The Path to Parity: Optimizing Residential Sale Price Prediction for Fair Taxation
Lumberjack Consultancy
2025-10-27
Where Are Expensive Homes?
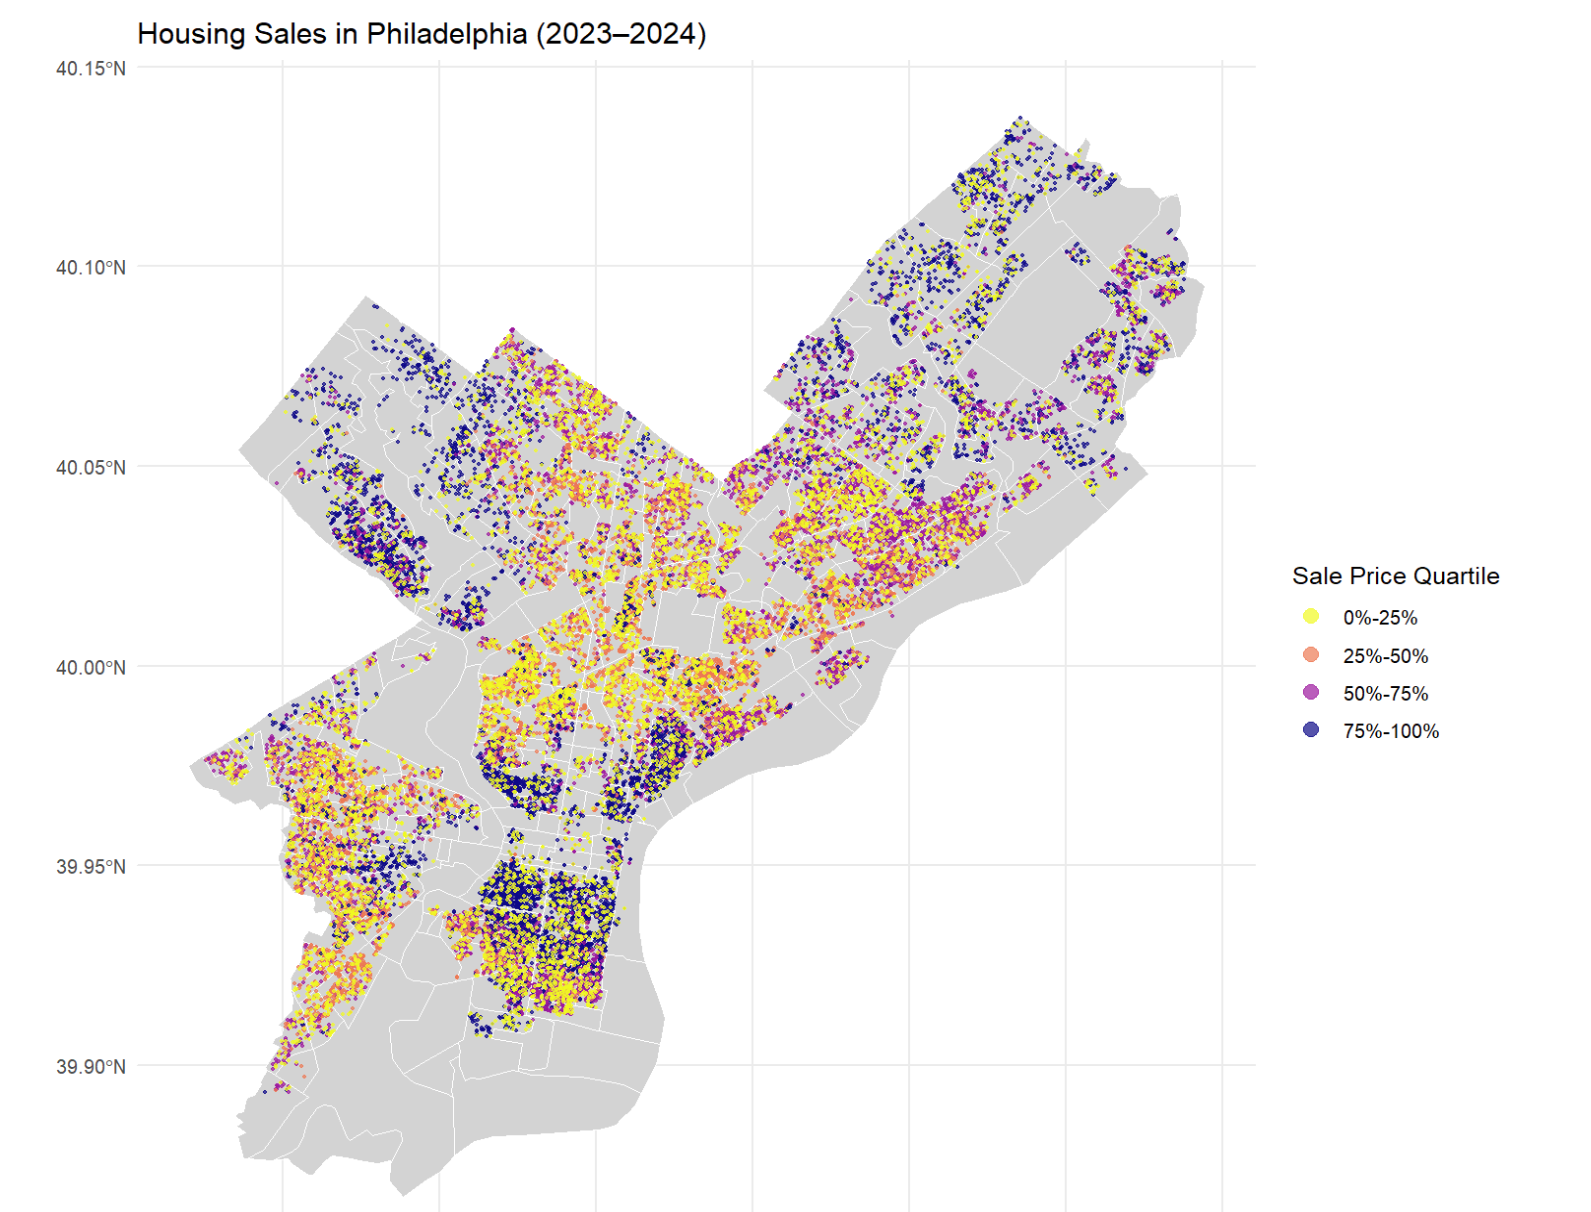
- Residential sale prices exhibited clear signs of spatial clustering.
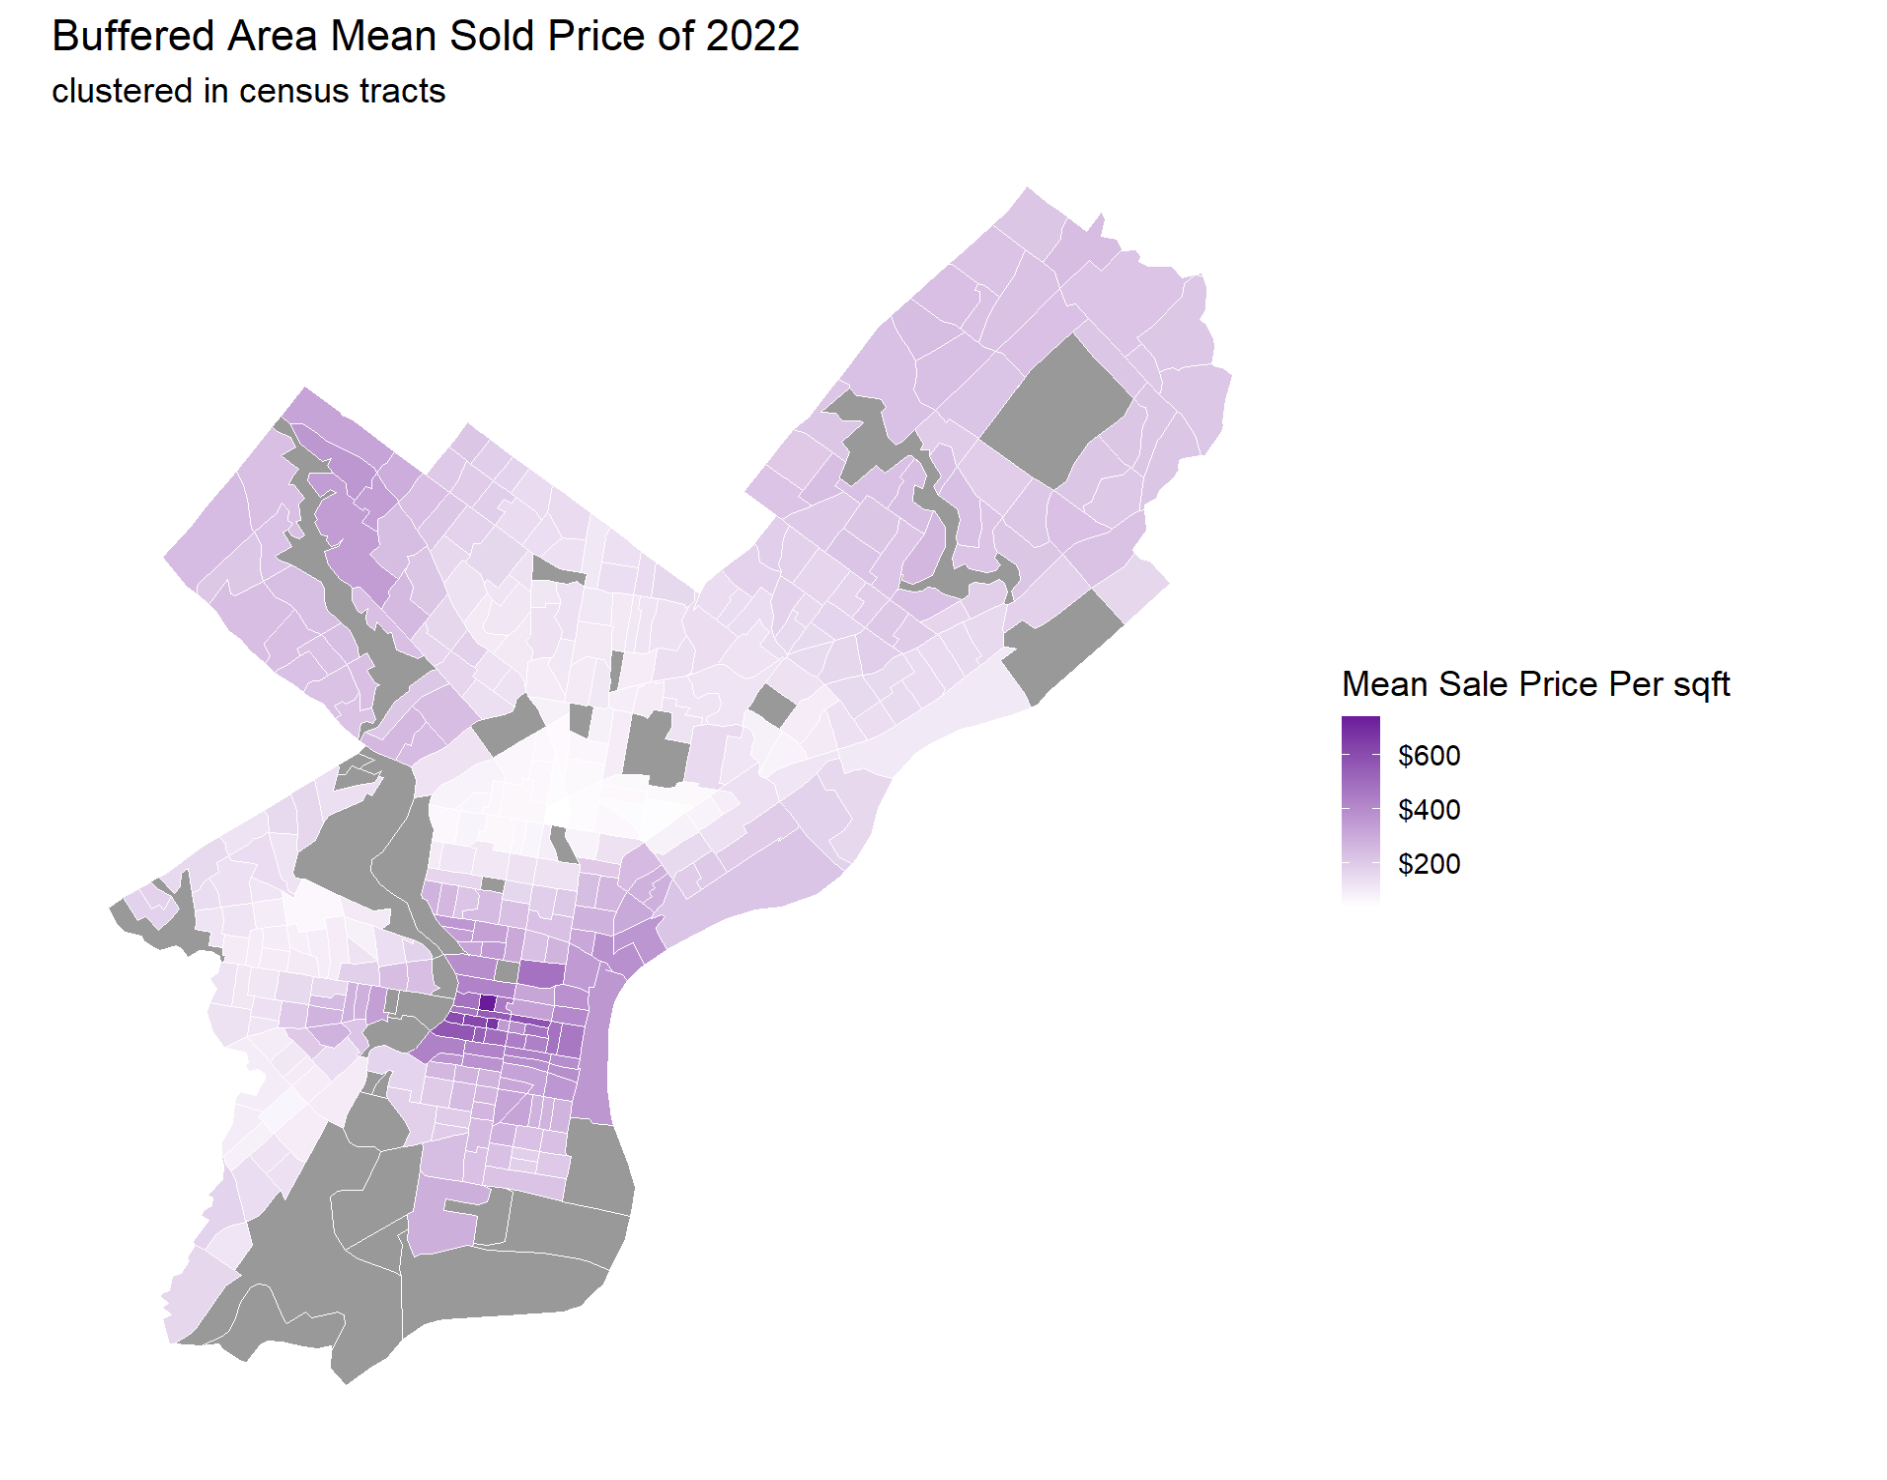
- highest-priced properties: Center City core, University City.
- Middle & Lower-Price tiers : North Philadelphia, West Philadelphia (outside the university sphere), and South Philadelphia.
- Account for the specific “micro-market” in which a property is situated.
Why Are They Expensive?
Highlight
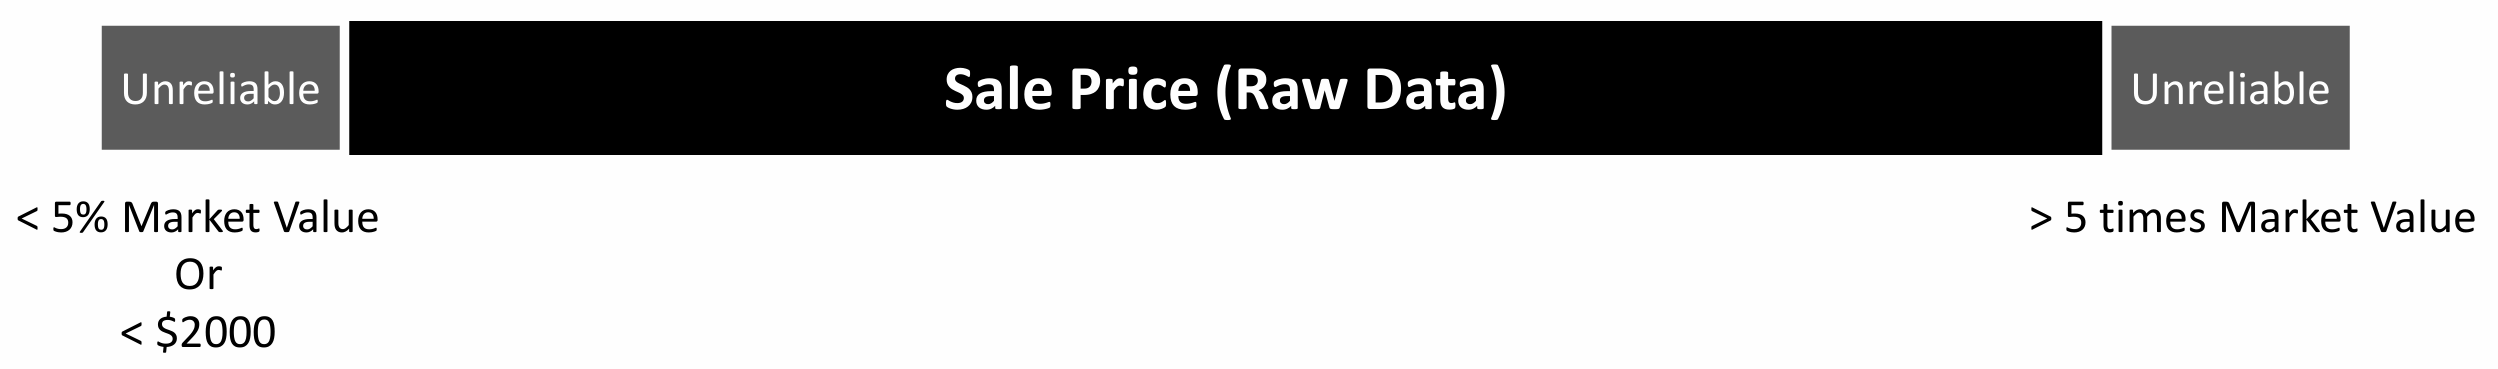
Our adjustment follows established mass appraisal practices, where implausible sale prices are identified and adjusted based on their ratio to assessed market value (Deaf Smith CAD, Mass Appraisal and Ratio Study Manual, 2023).
Principle:Retain all information that the data tells us (including outliers) rather than deleting it.
Objective:Ensure equity.
Relationship Formula:
Sale Price = -9189.29 + 1.03*Market valueApproach: Unreliable sale price(low weight)~ Reliable sale price(high weight)
Identifying the Hardest-to-Predict Neighborhoods
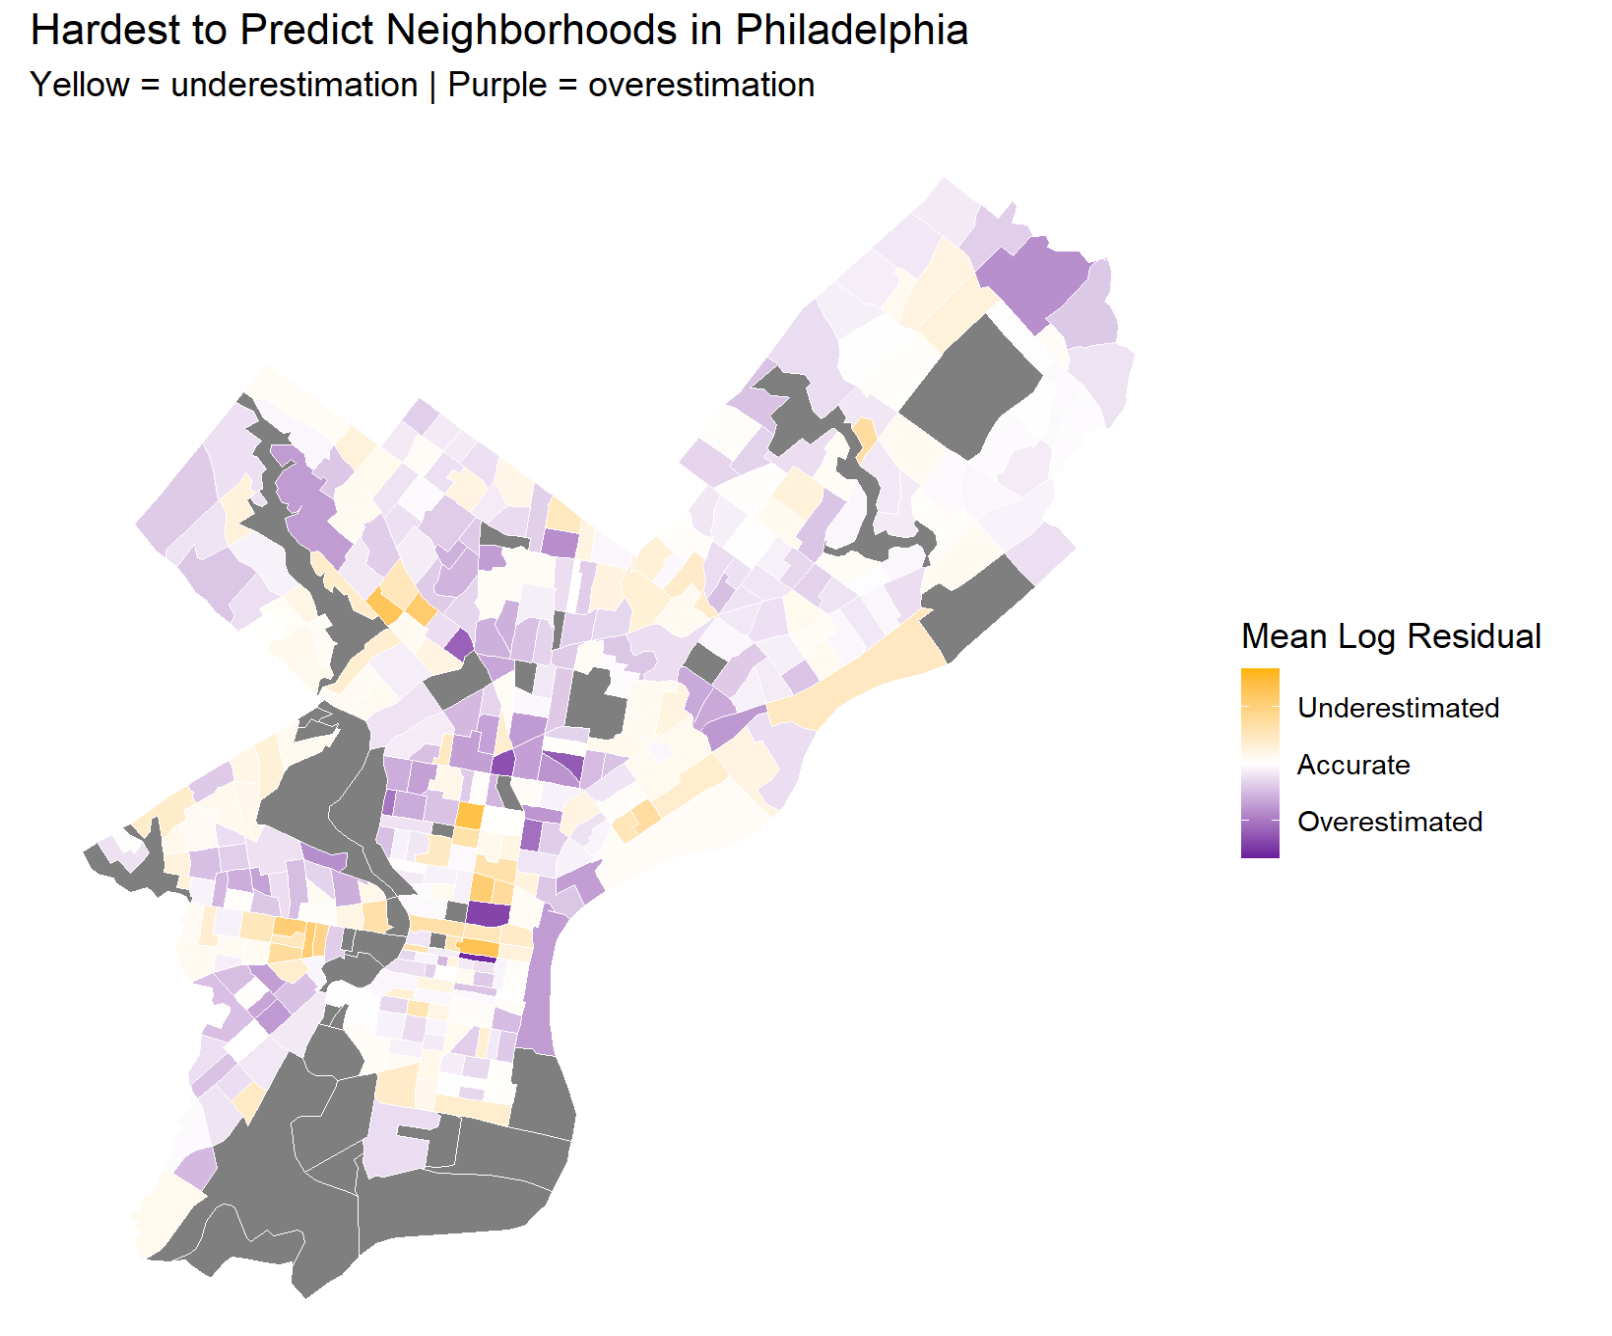
Interpretation
- Underestimate zip code: 19130, 19123, 19104, 19144…
Overestimate zip code: 19102, 19107, 19116, 19154… - Market is moving faster than the city’s valuation system can keep up.