Philadelphia Housing Price Prediction
Improving Property Tax Assessments
2025-10-26
Are current property tax assessments in Philadelphia fair and accurate?
Property taxes depend on OPA’s assessed values.
Assessments often deviate from actual sale prices.
Some areas are consistently over- or under-assessed.
Unequal assessments create unfair tax burdens.
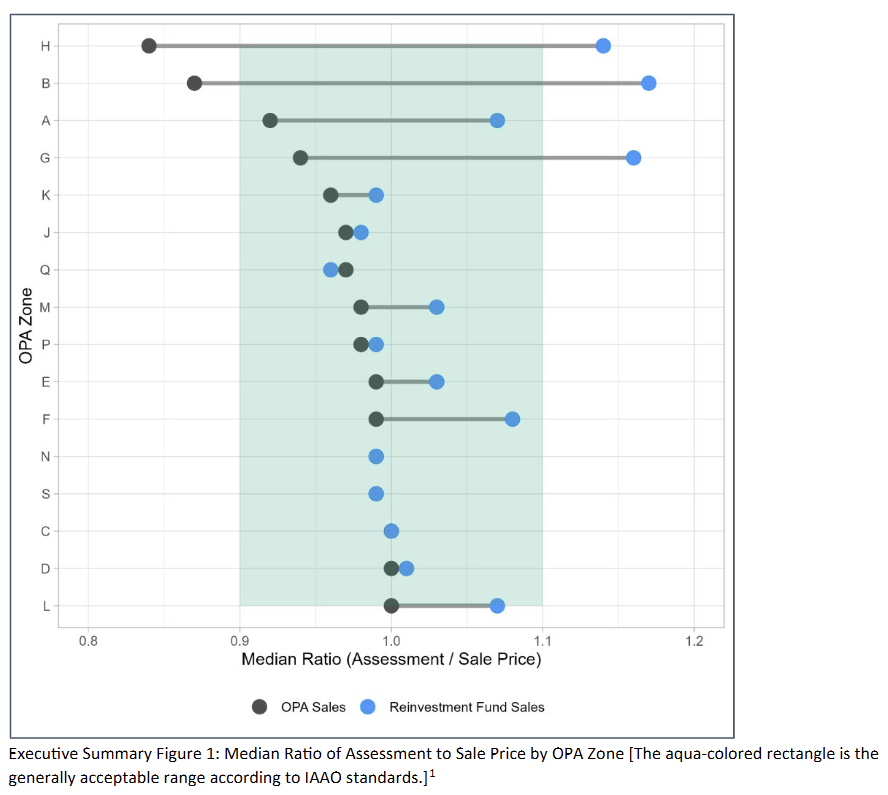
Source: Reinvestment Fund, Examining the Accuracy, Uniformity & Equity of Philadelphia’s 2023 Real Estate Assessments (Apr 2024).
Data Sources
Philadelphia Property Sales (n= 24023,2023-2024)
Census ACS (Income, Education, Poverty)
OpenDataPhilly (Number and Distance: Crime, Park&Recreation, Transportation, Hospital,School )

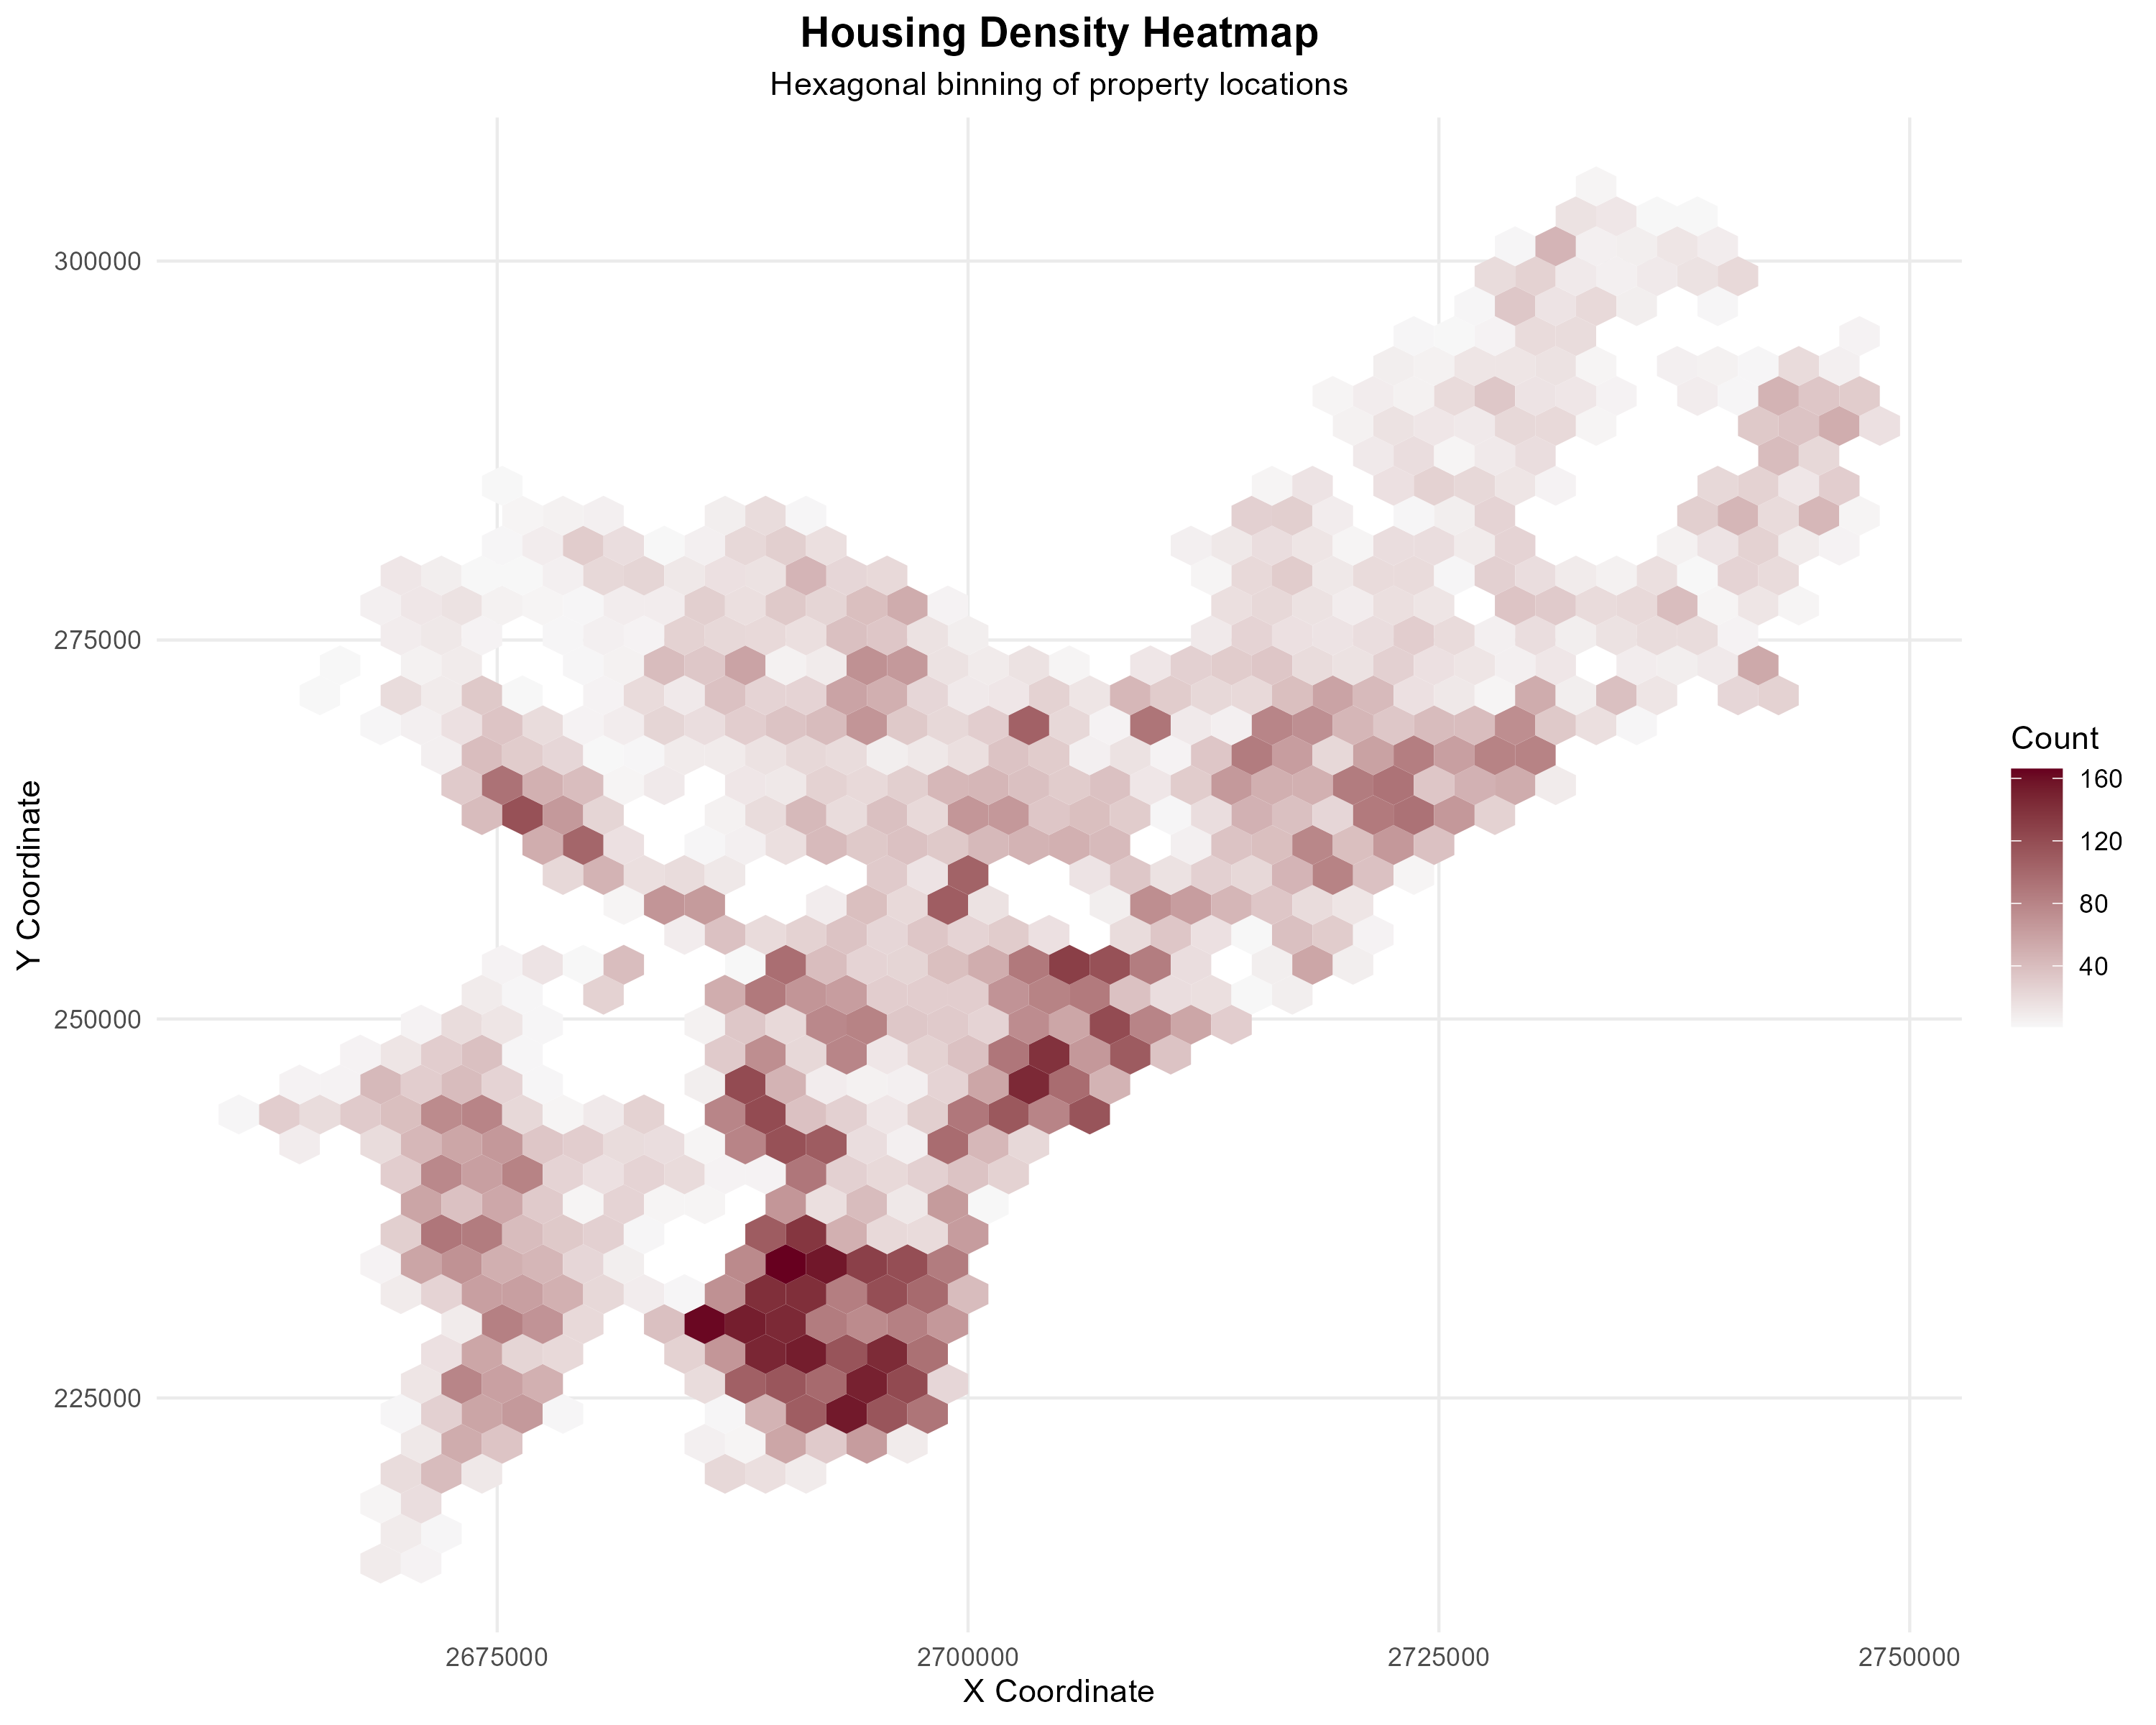
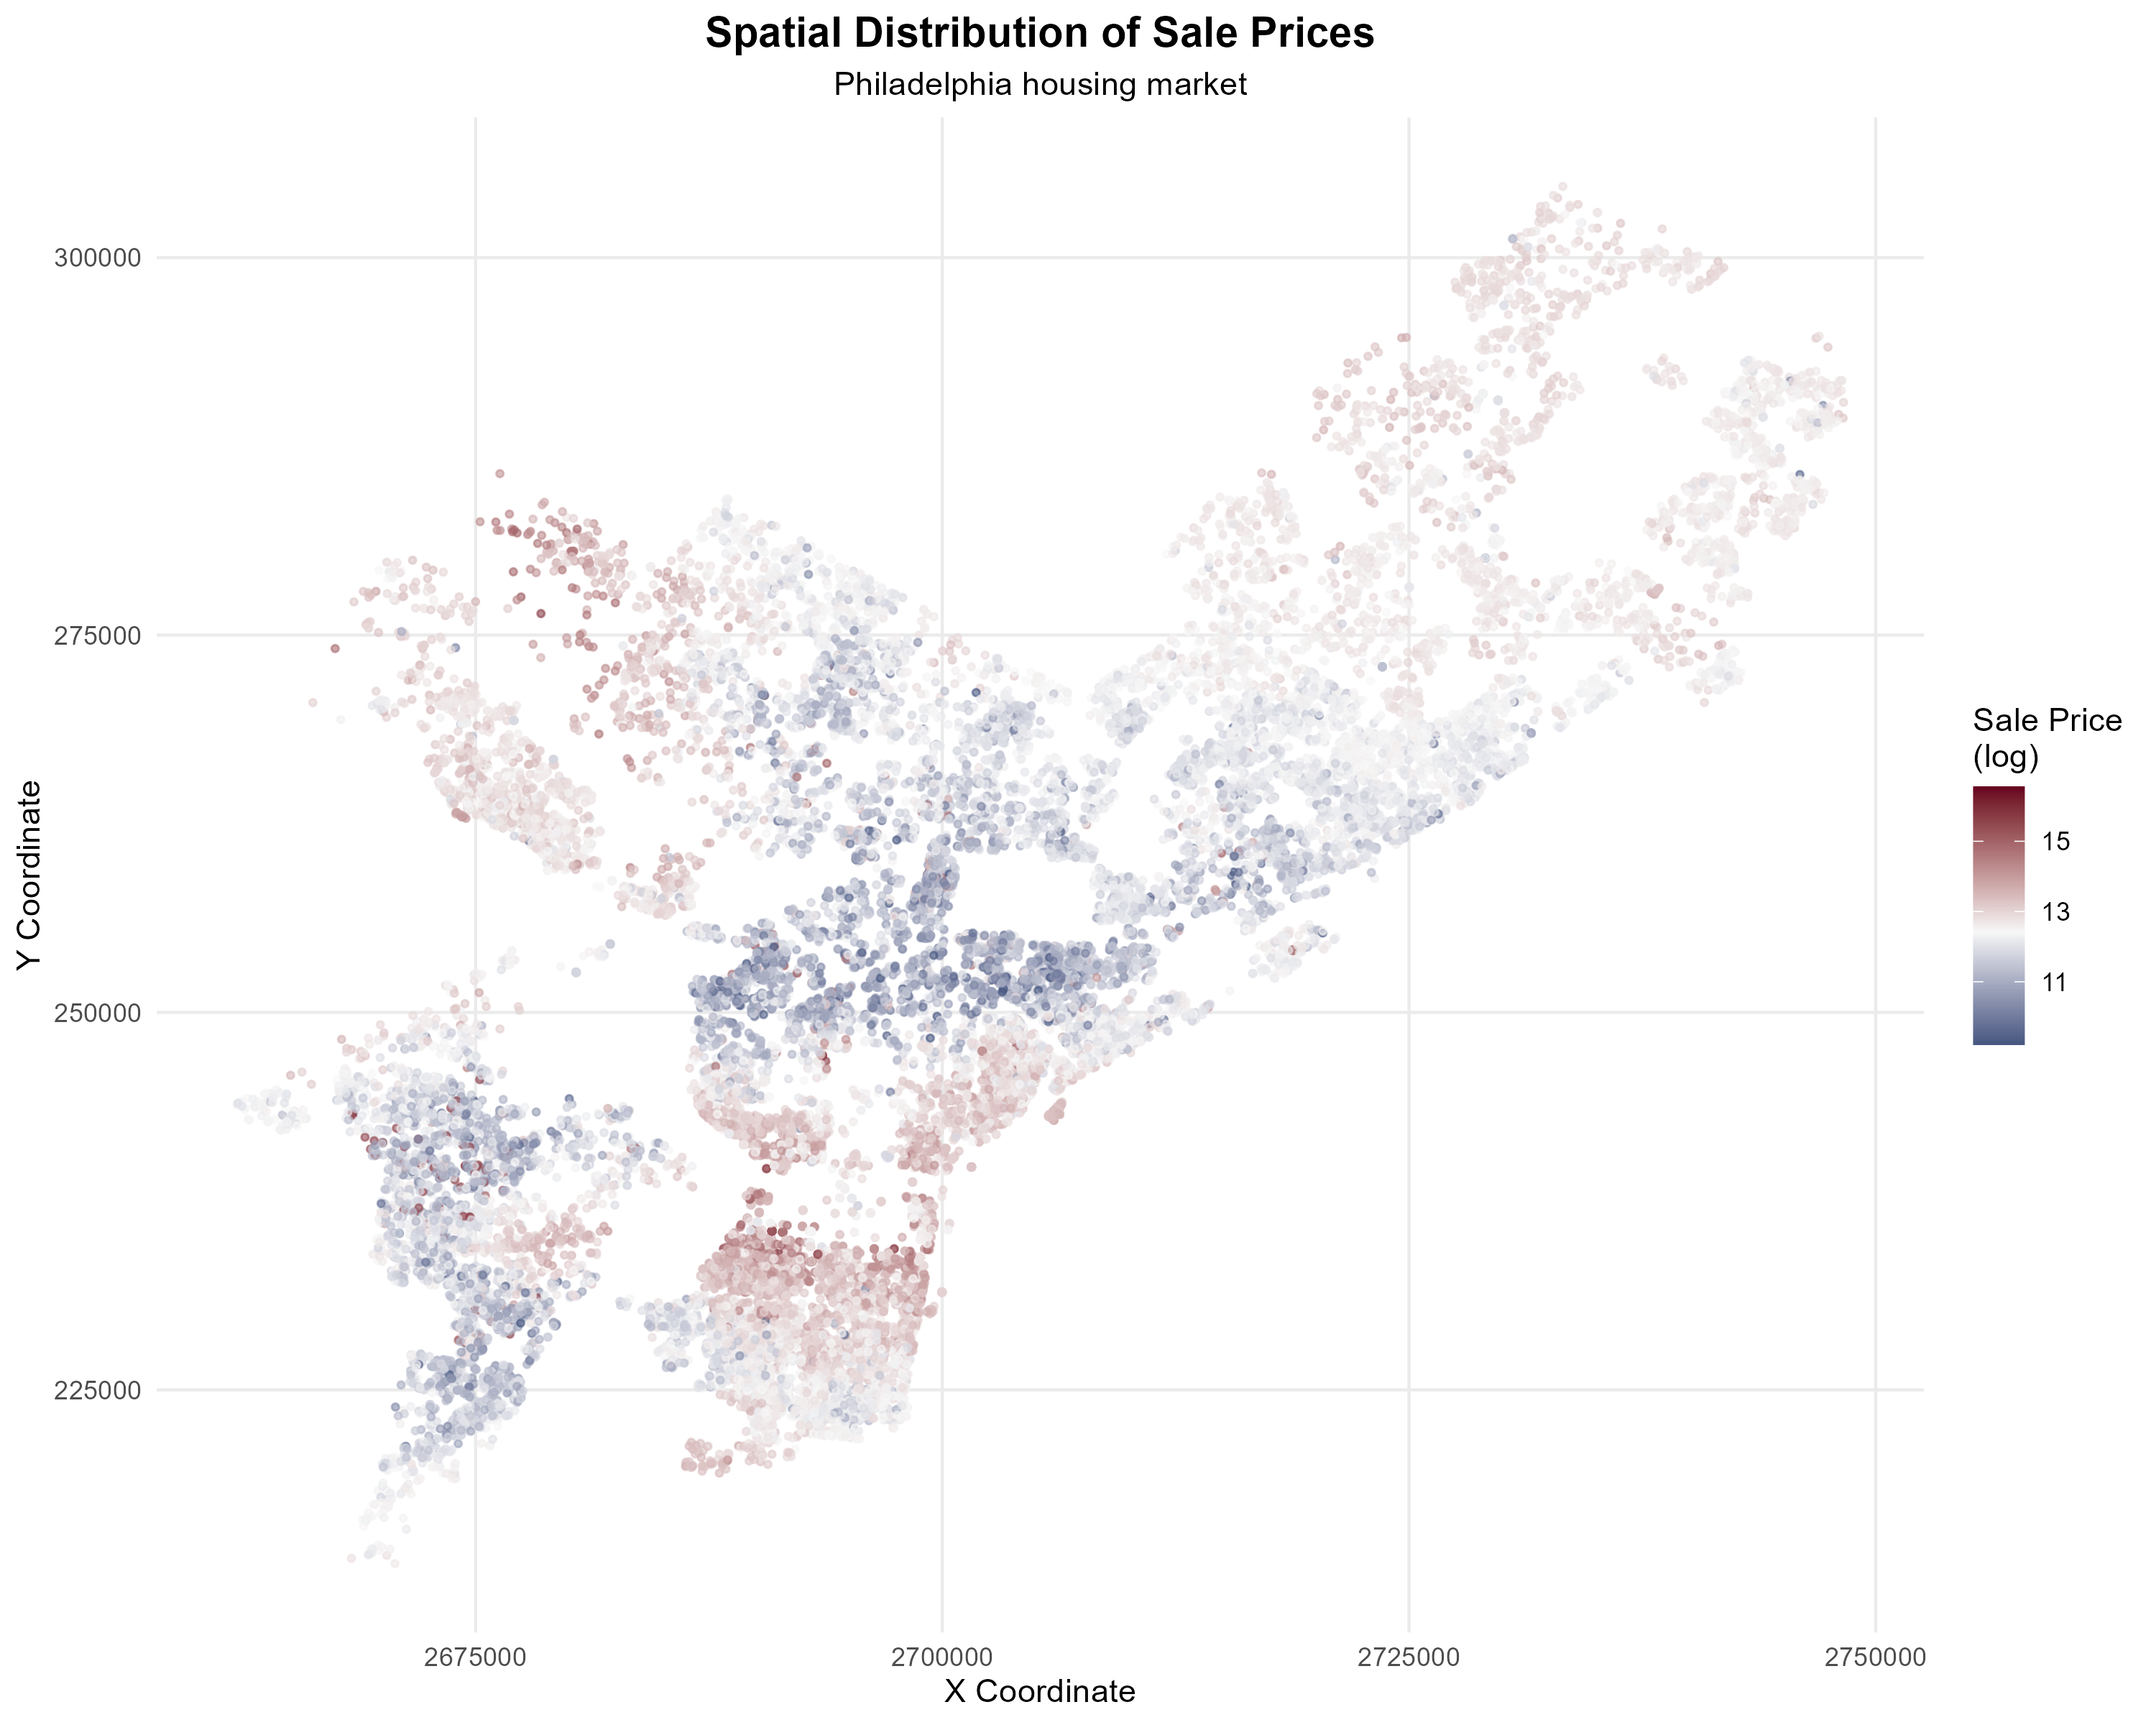
Spatial Distribution of Housing and Prices
Where Are the Houses?
Where Are the Expensive Houses?
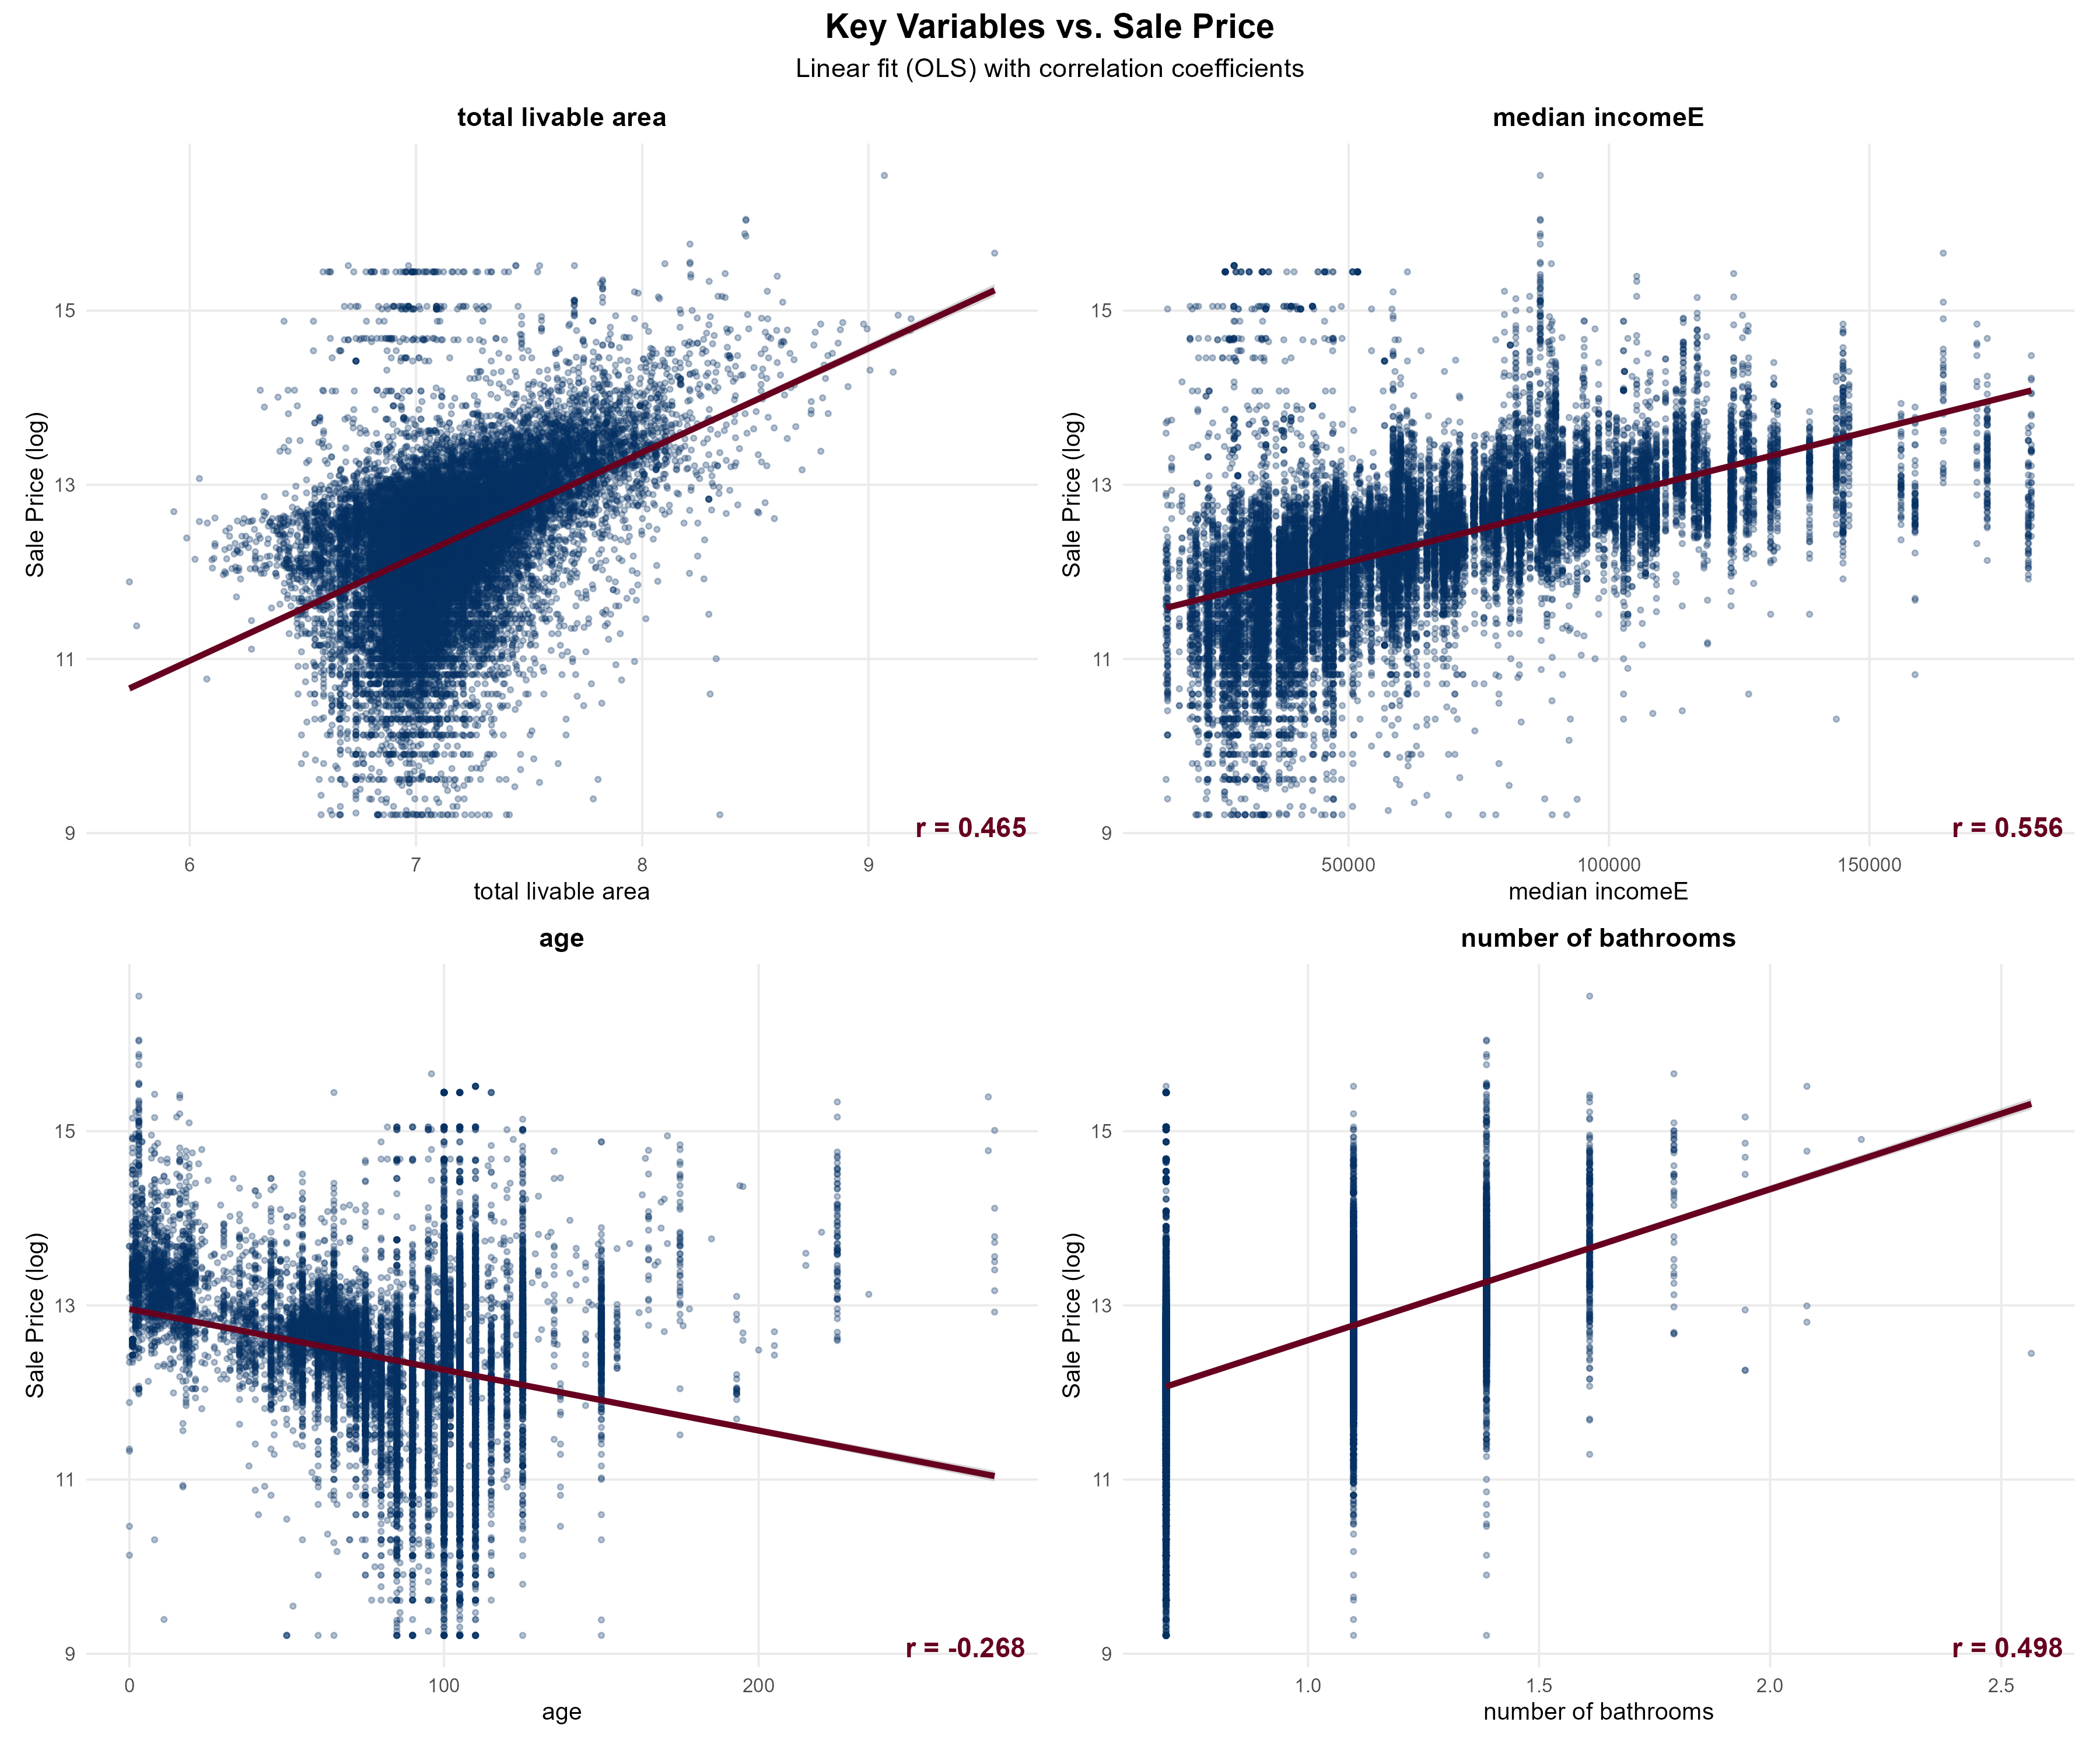
Larger homes, higher neighborhood income, and more bathrooms increase prices — while older properties tend to sell for less.
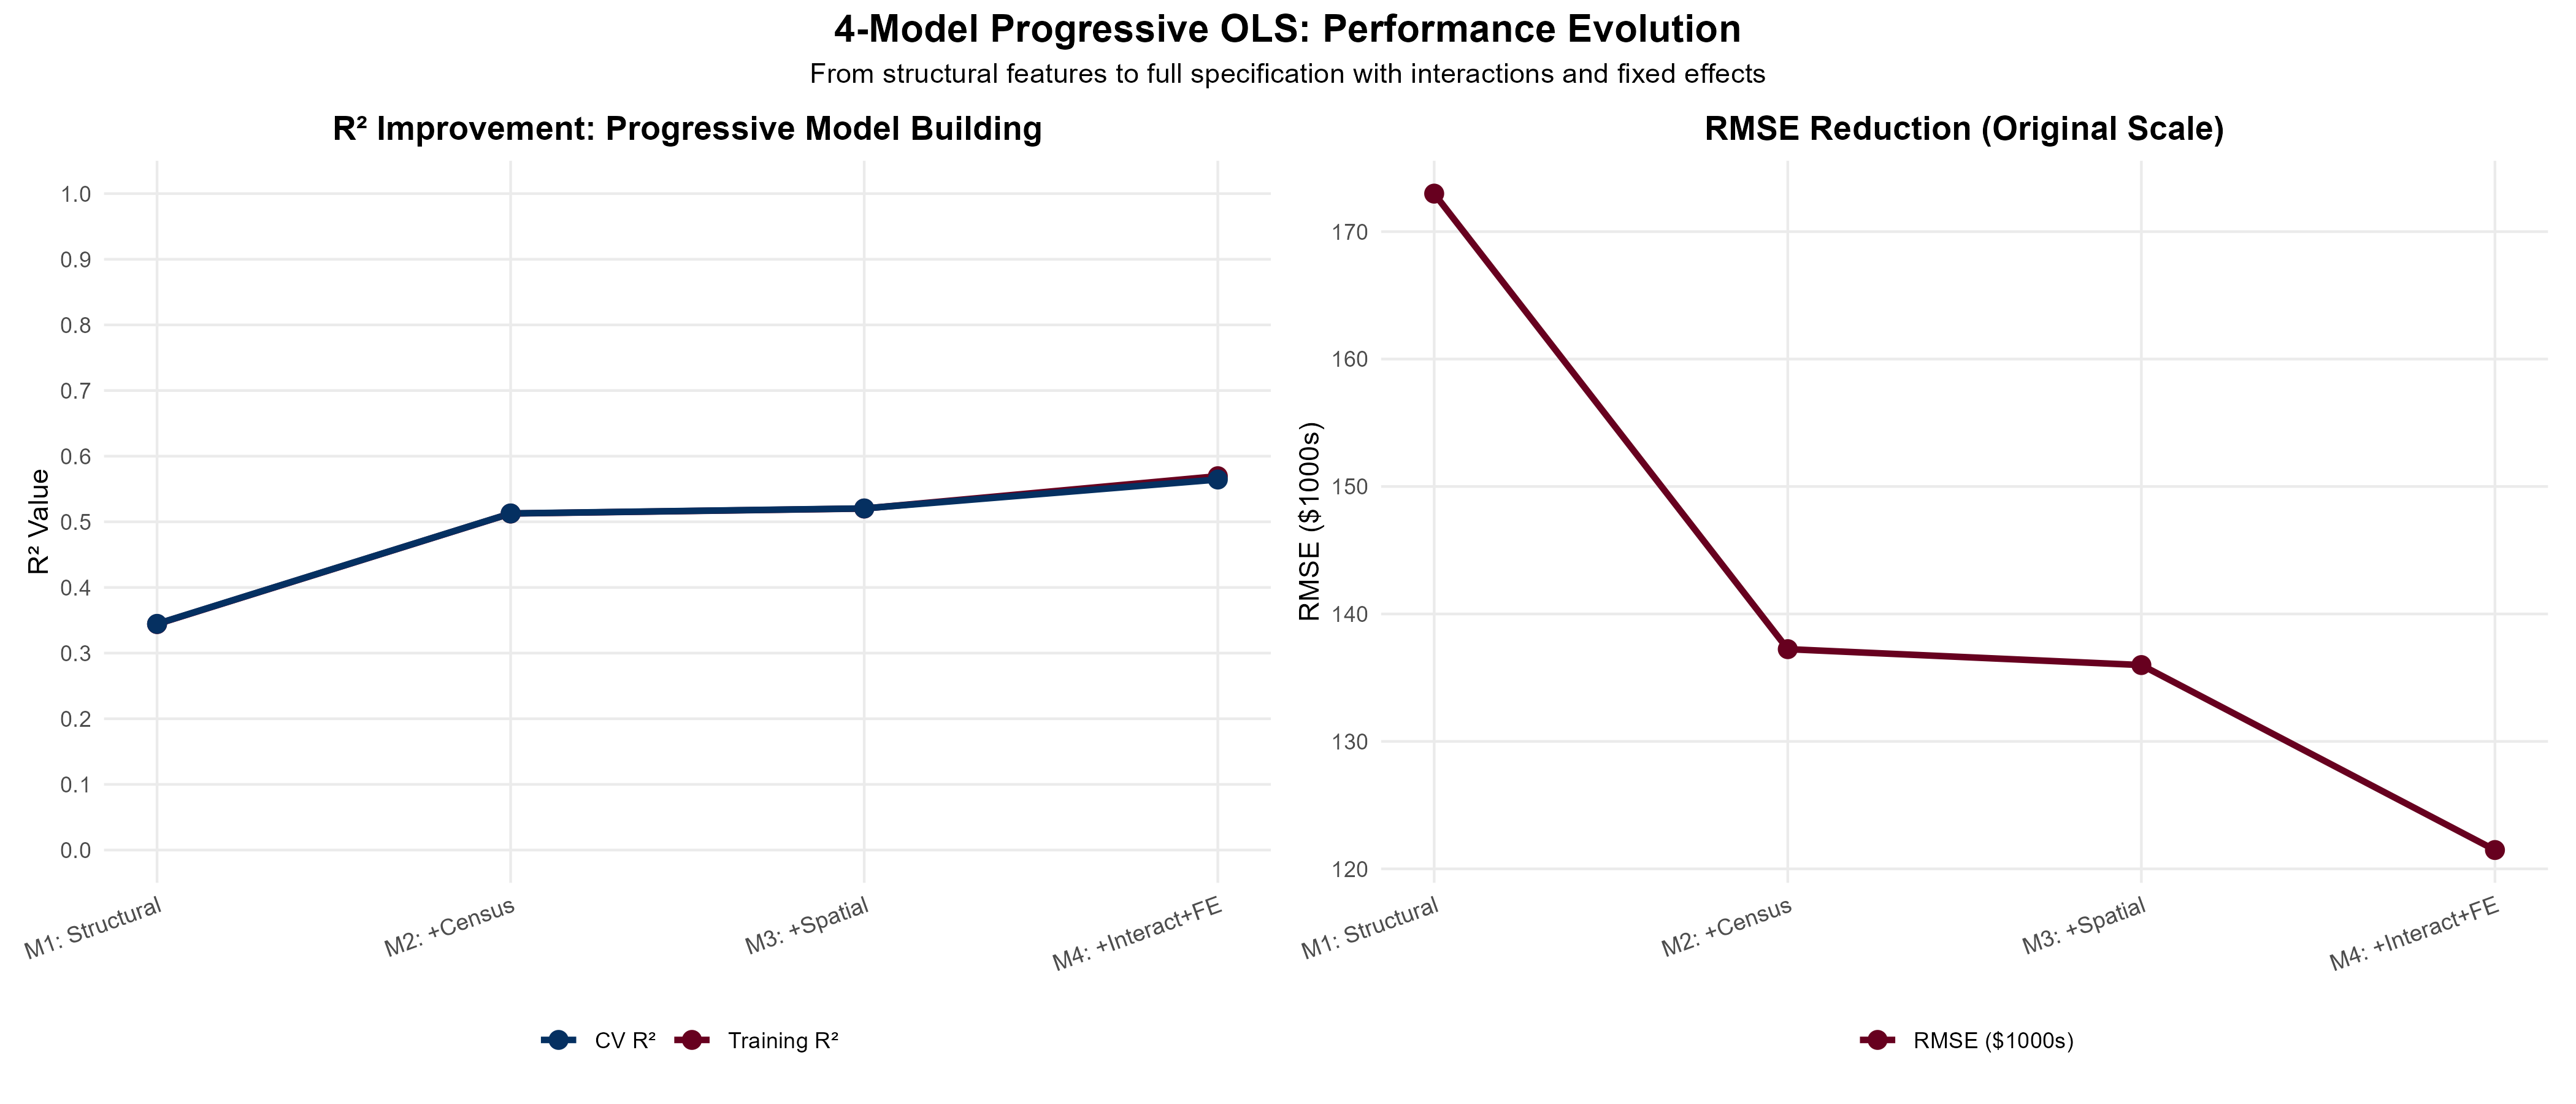
Adding more real-world data to build a more fair and accurate housing price model
M1: Basic home features (size, age) → simple but limited
M2: + Census data → adds community context
M3: + Spatial data → captures location effects
M4: + Interactions → reflects real neighborhood differences
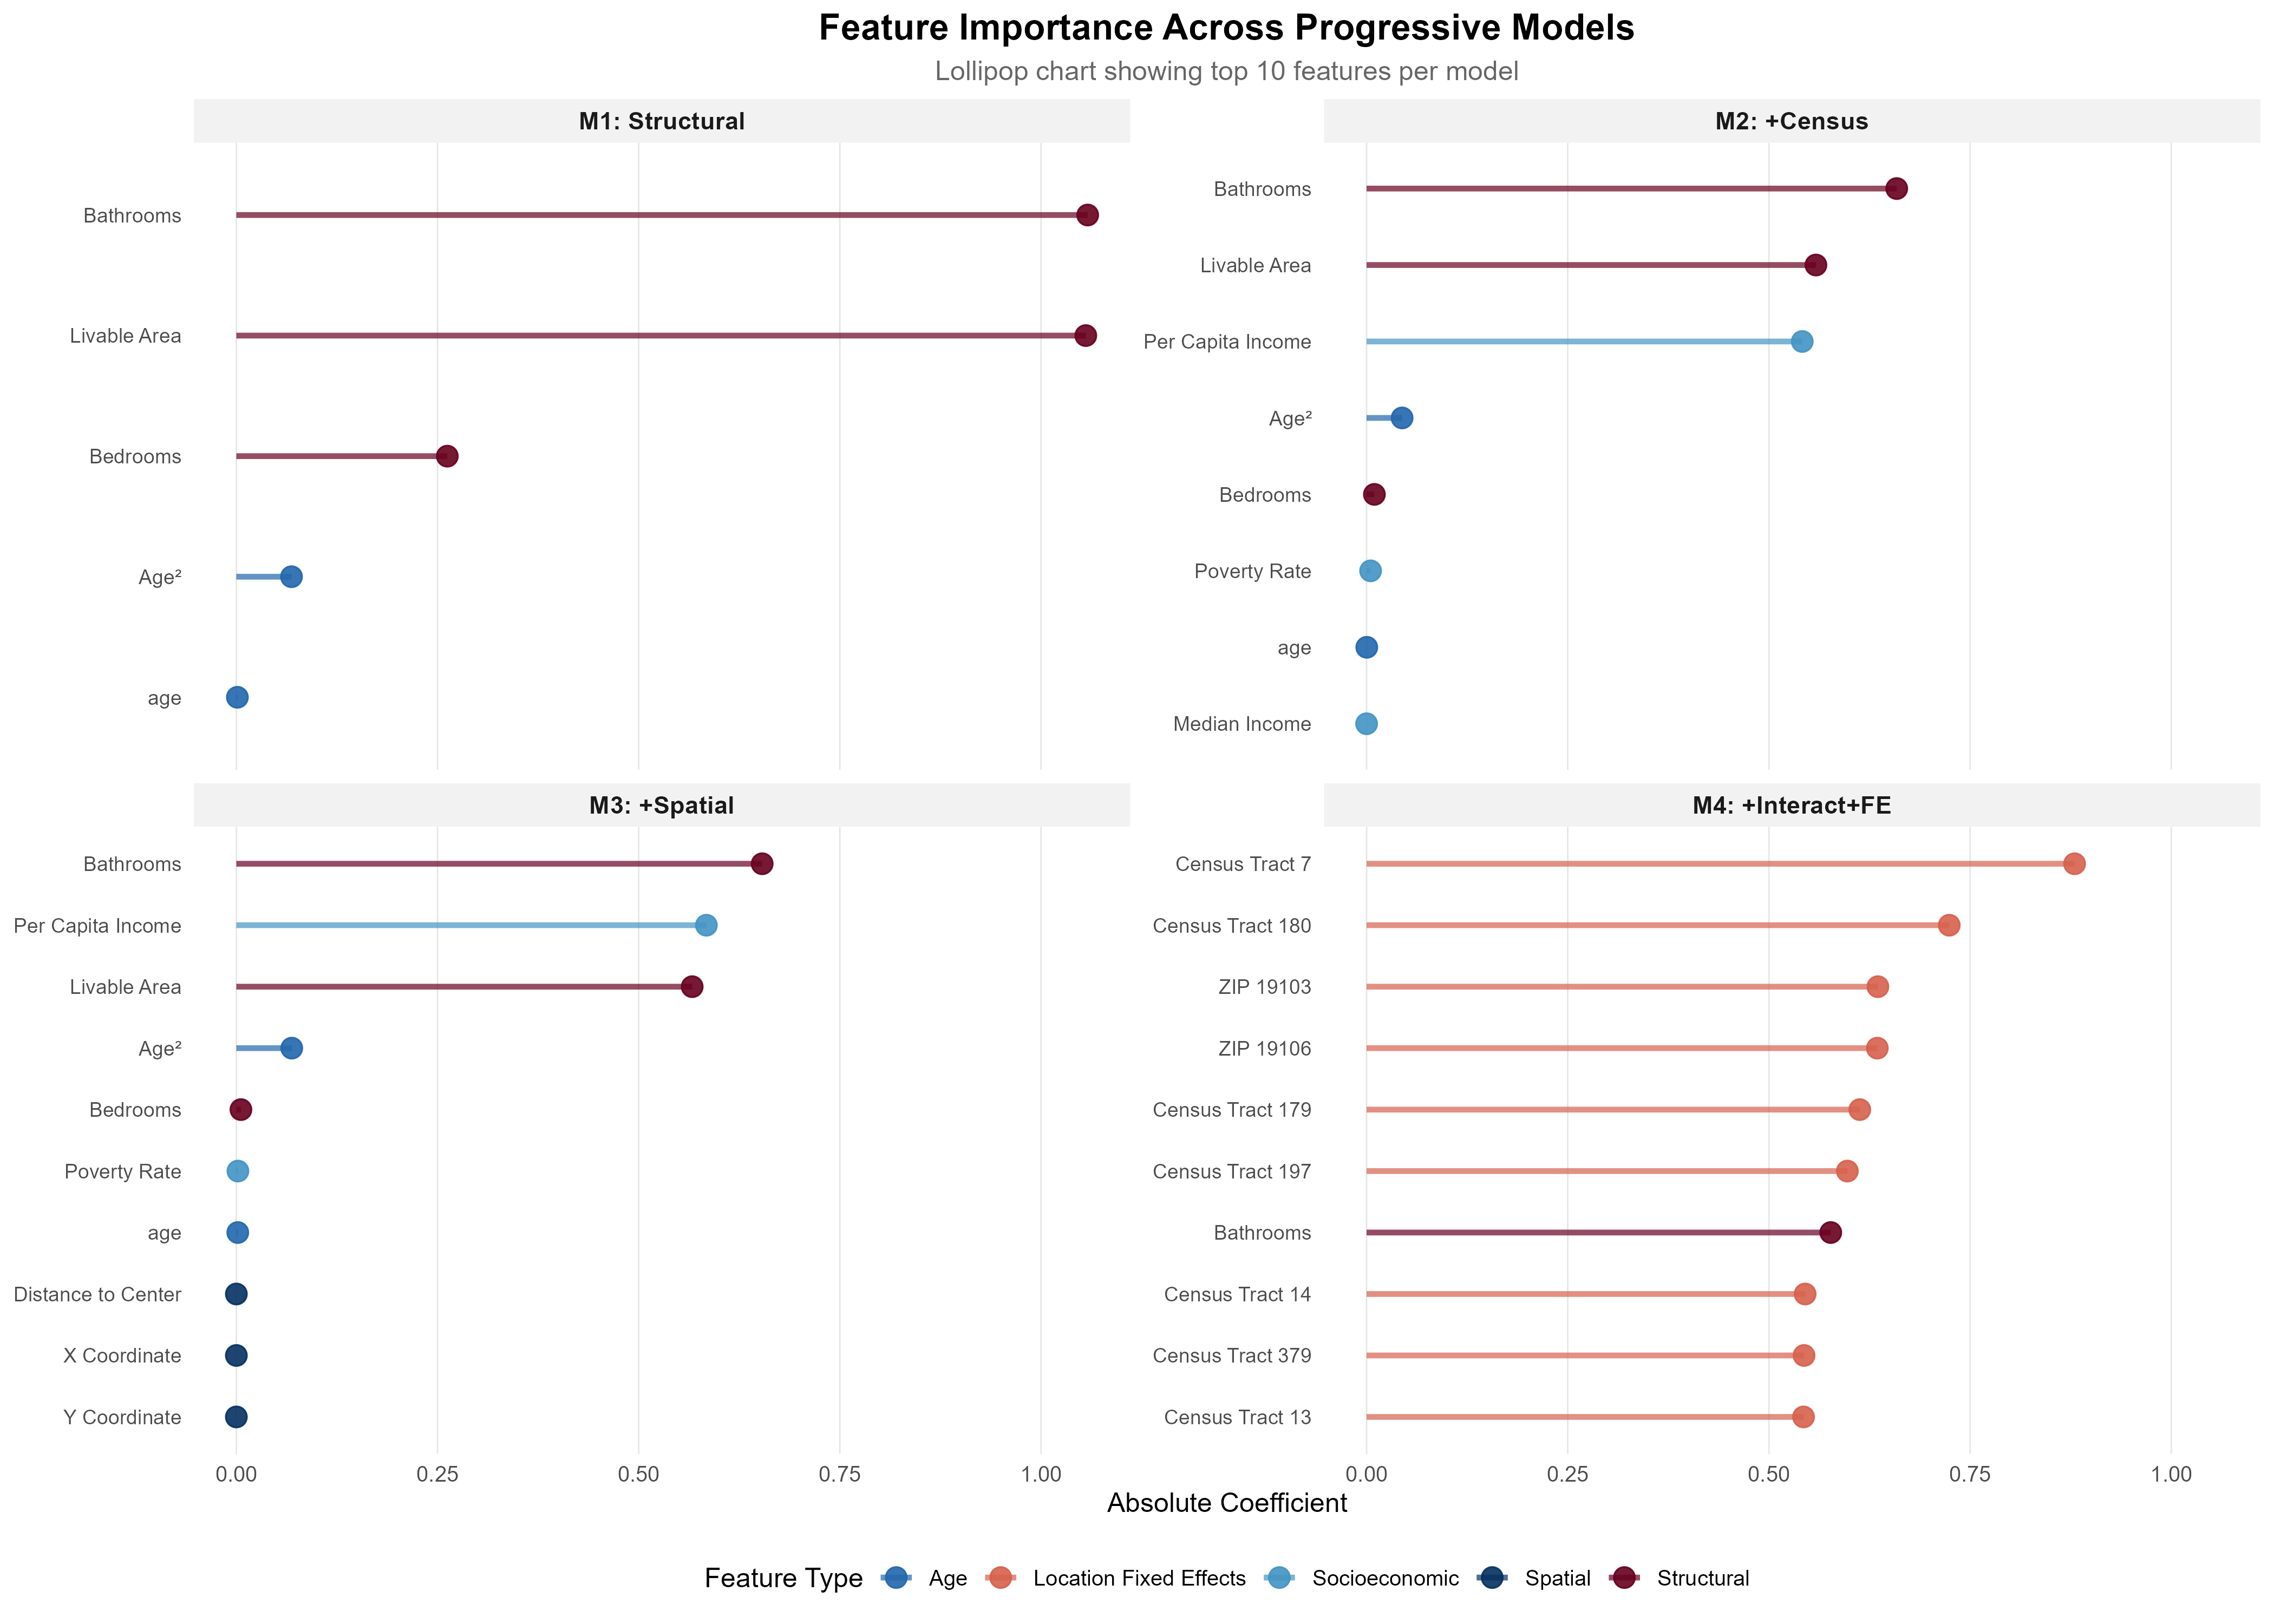
Home size and bathrooms remain important across all models, while neighborhood and location features gain influence after improving.
- Bathrooms and Livable area stay top-ranked across all models
- Income and Census tract rise in importance as they’re added
- Final model shows Location Effects becoming dominant predictors of price
Model Performance: The predicted prices from our final model align strongly with actual sales.
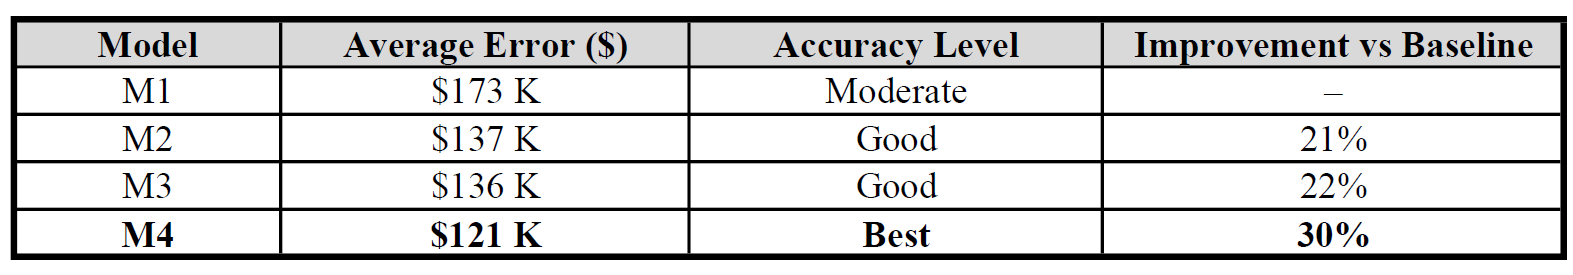 > “Average Error($)” shows the average gap between predicted and actual prices (lower = more accurate).
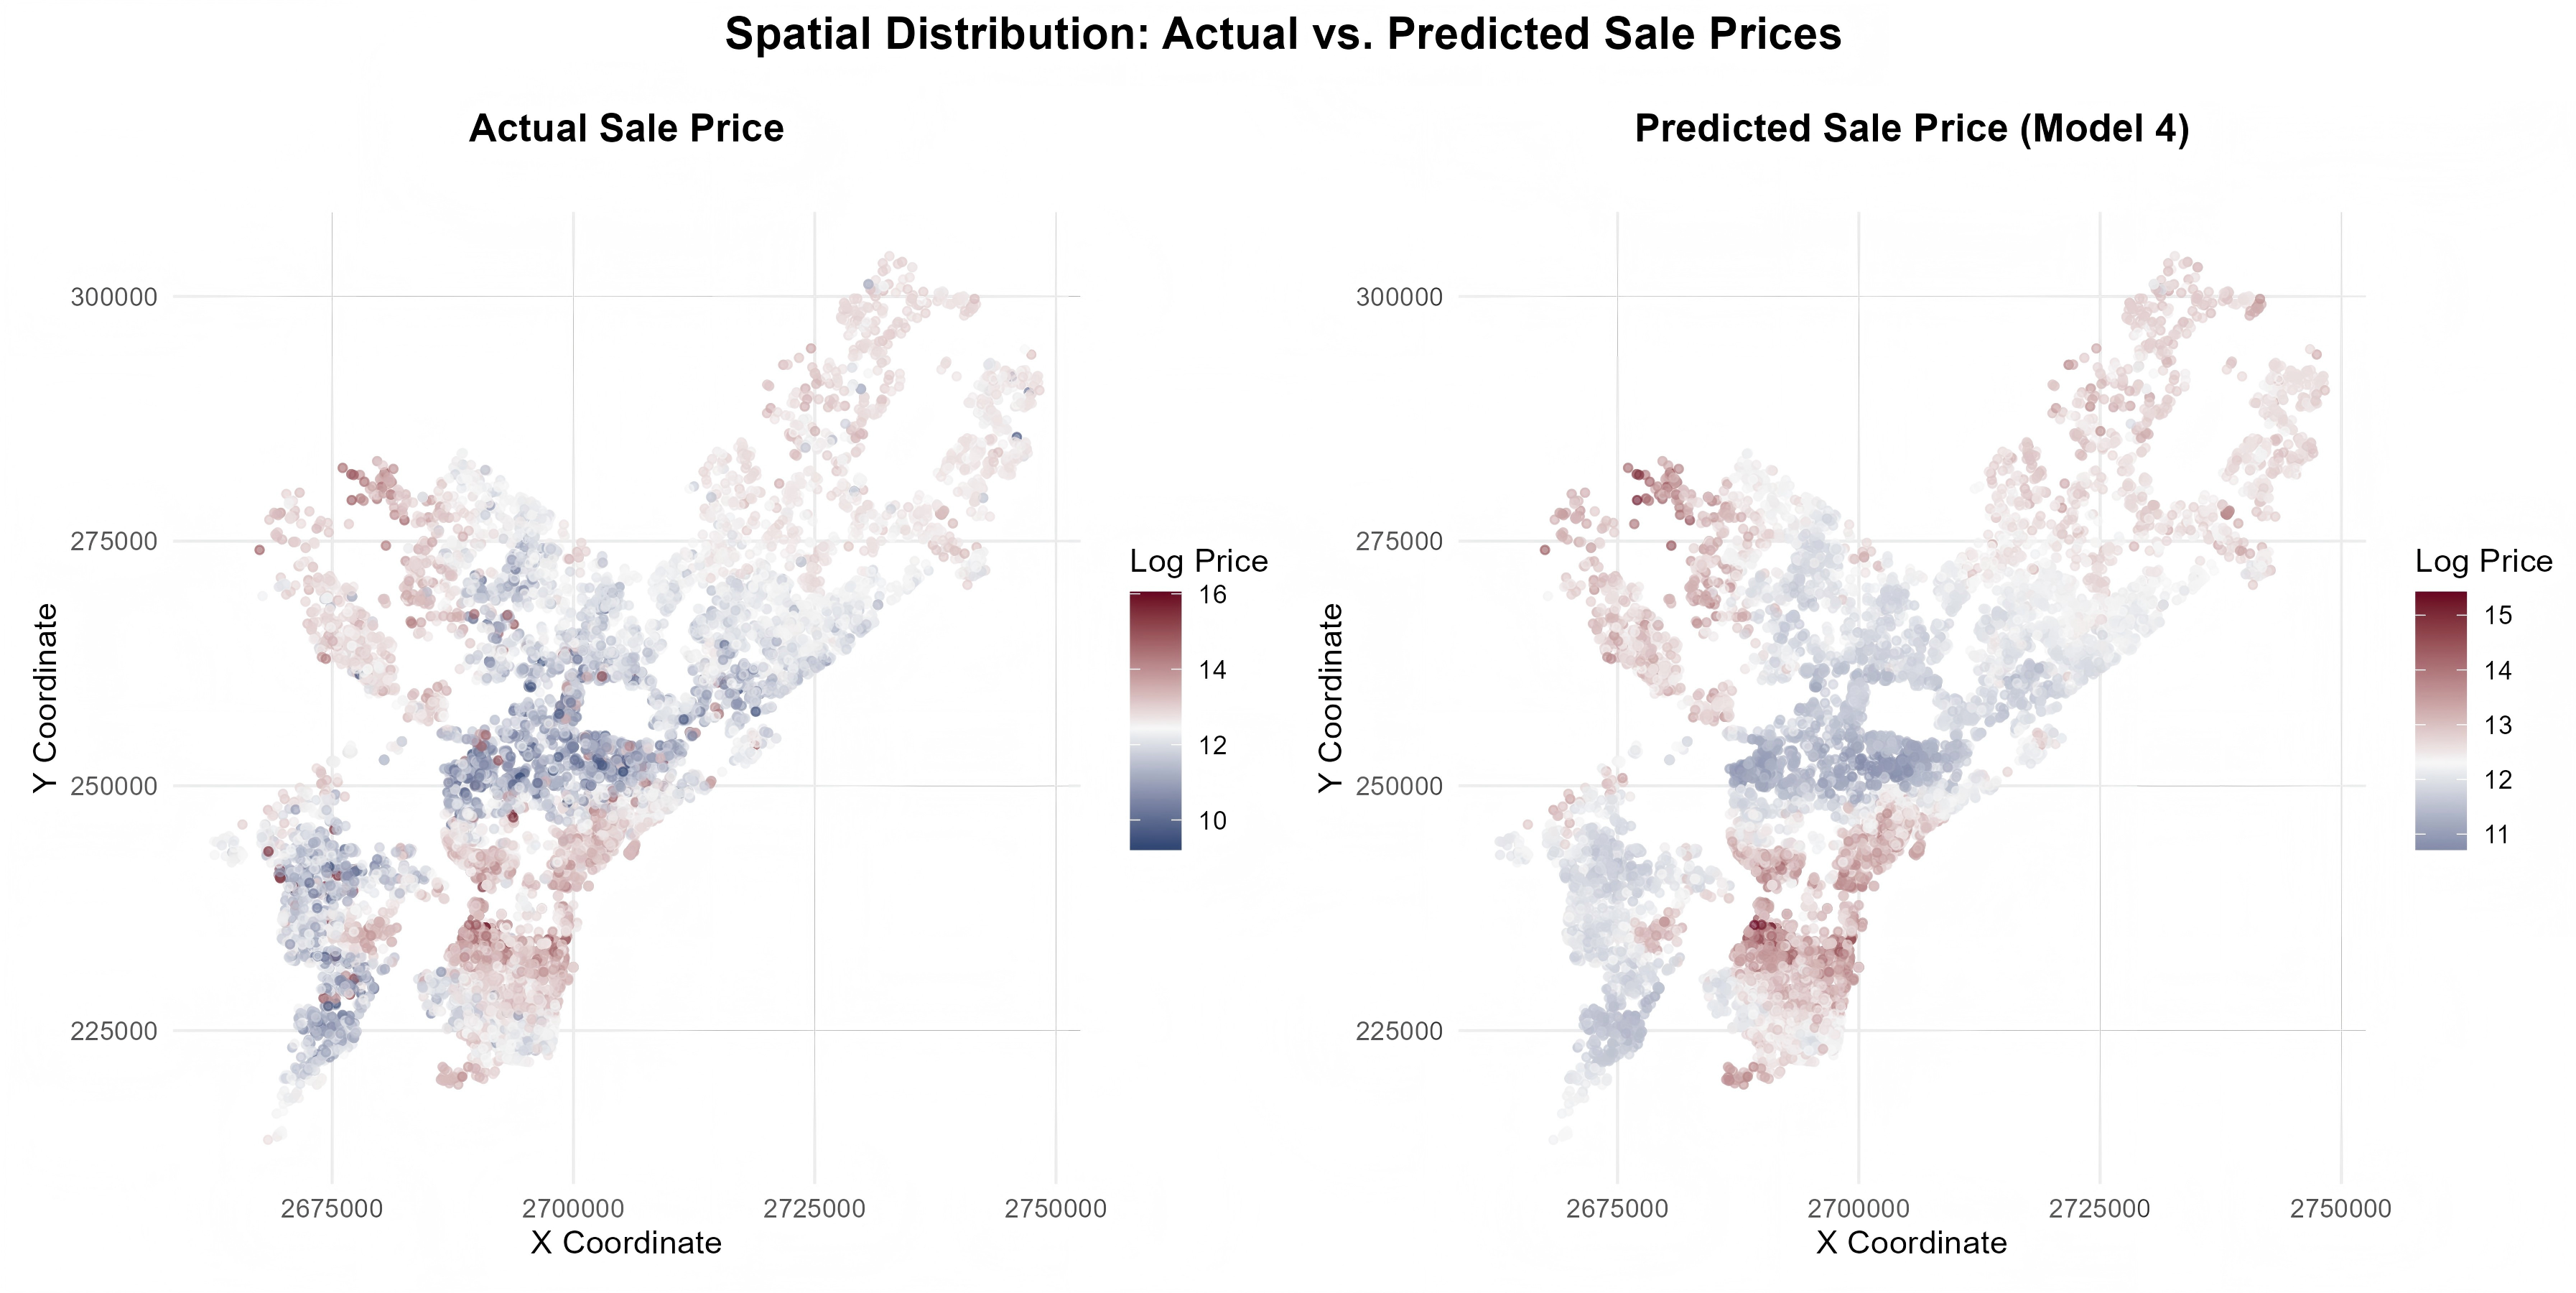
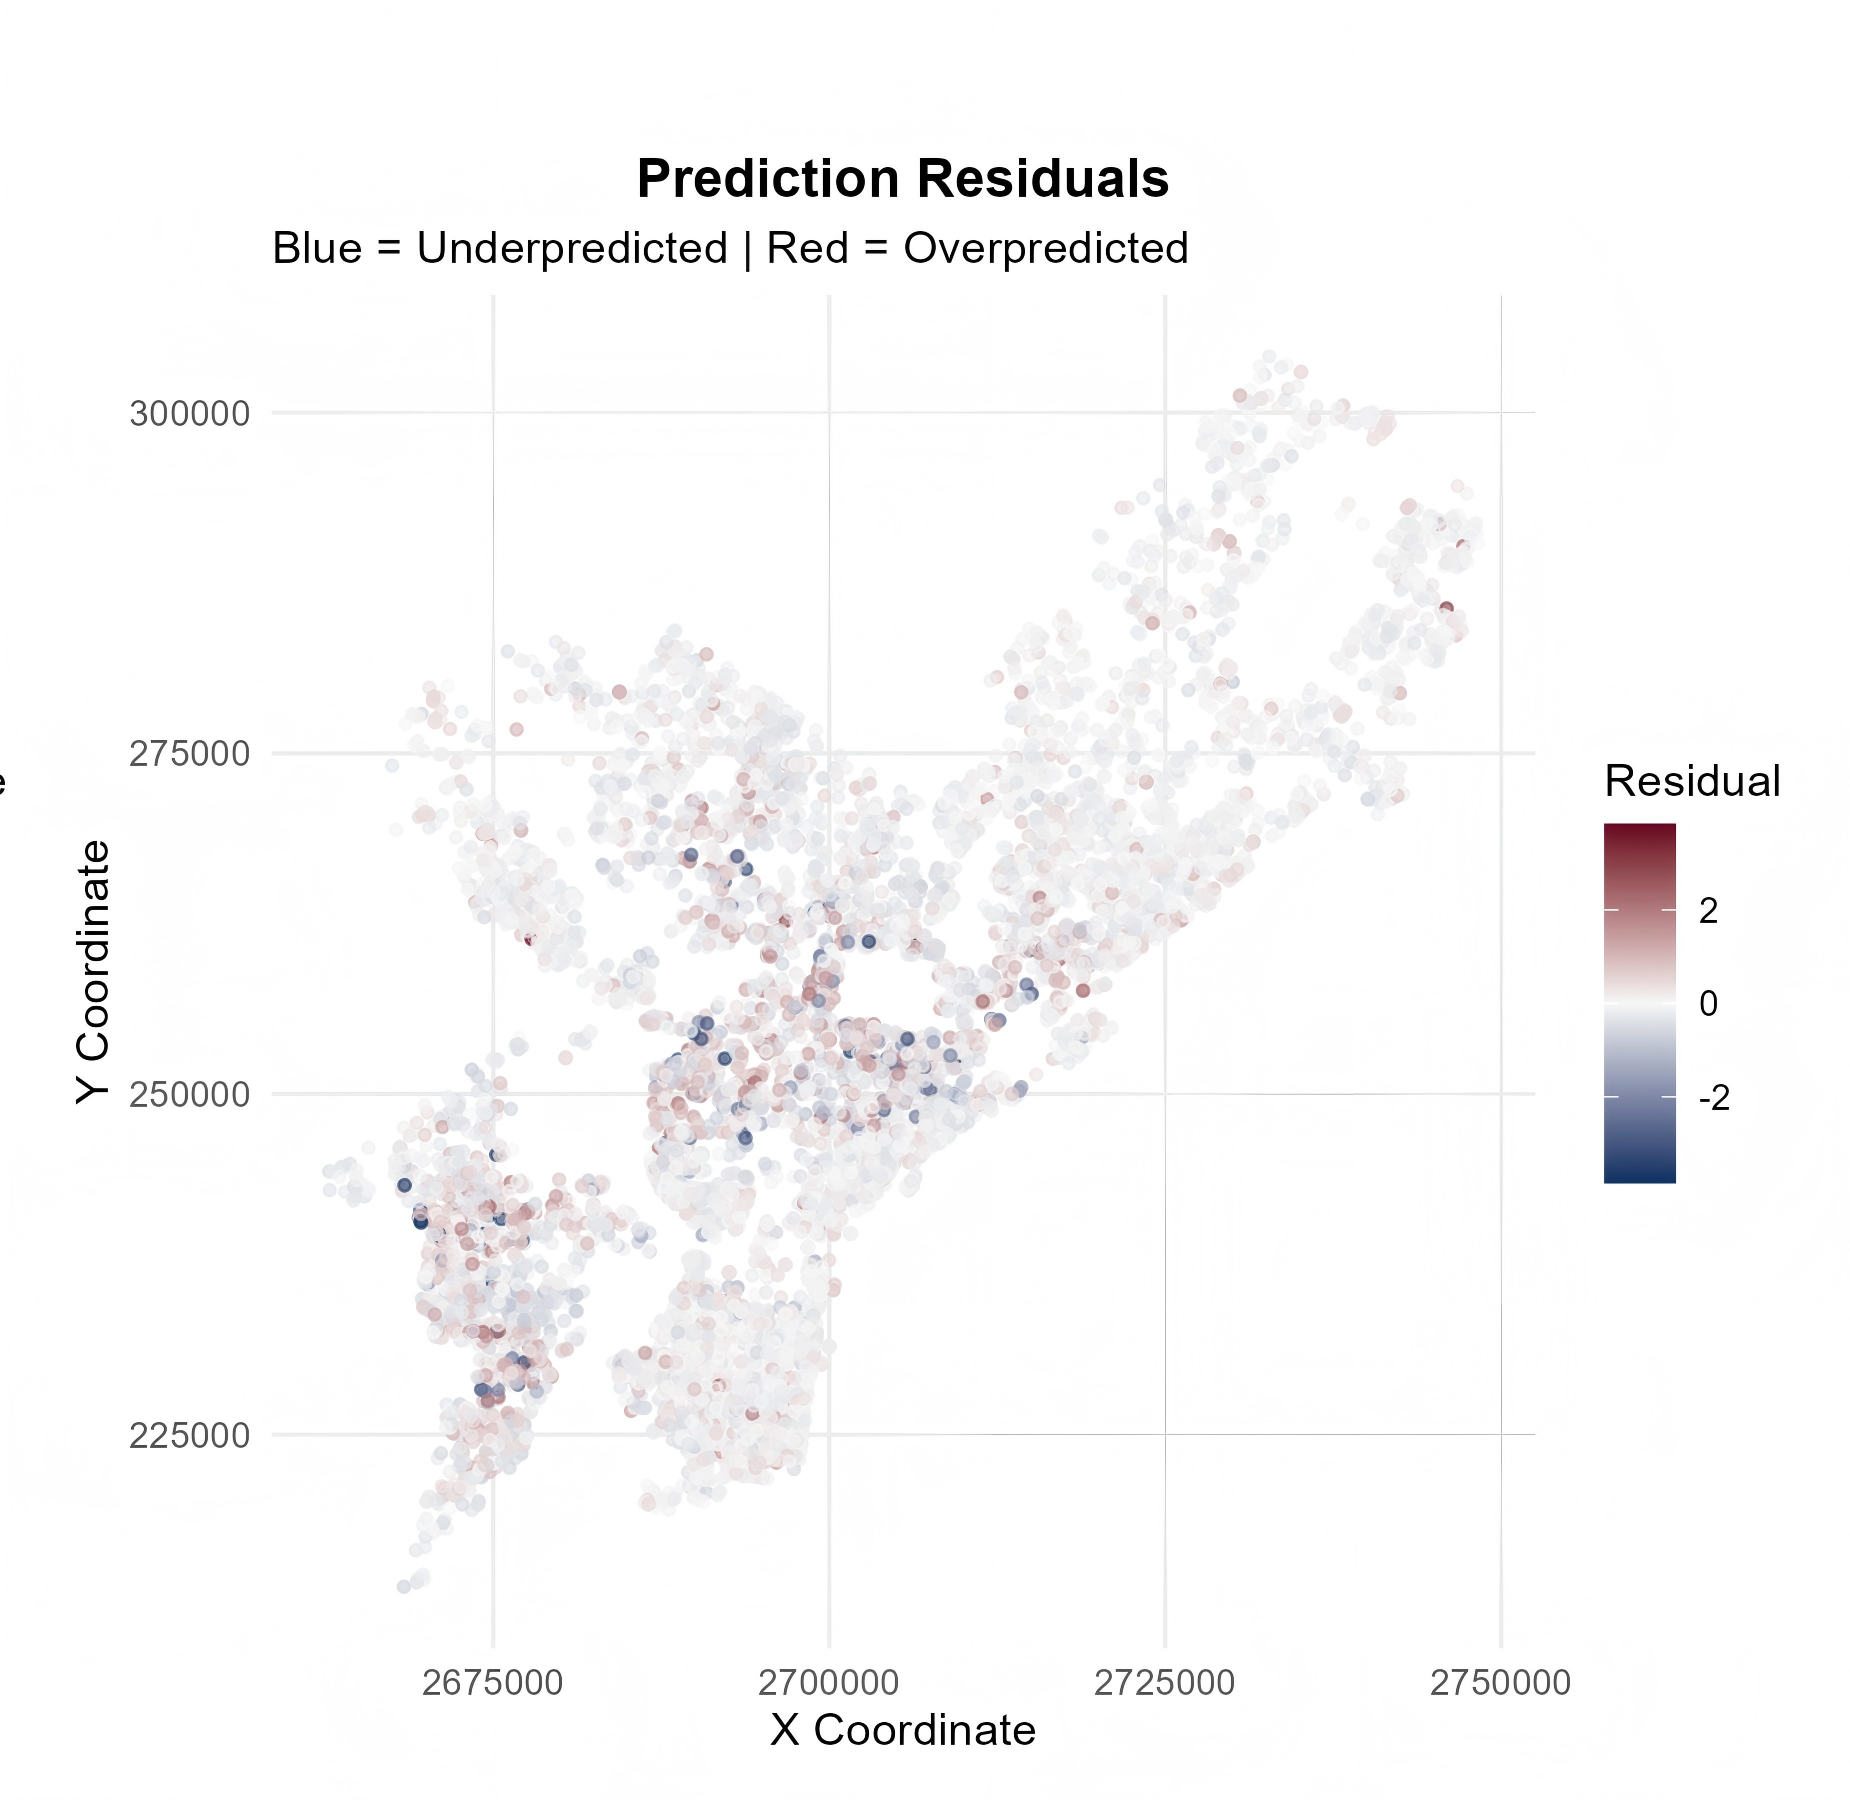
The map highlights neighborhoods where predicted prices differ most from actual sales.
Interpretation
Blue areas: Homes undervalued by the model → may face under-assessment
Red areas: Homes overvalued → may face over-assessment
Central & southern zones: show the largest mismatches — indicating uneven market patterns
> The areas, shown in deep red or blue, are likely where property assessments are least accurate, and where tax fairness may be at greatest risk.
> These “hard-to-predict” areas should be prioritized for review in future assessment updates.
Thank You
Turning Data into Fairer Assessments
Project Team
Xiaoqing Chen
Zicheng Xiang
Lingxuan Gao
Zhiyuan Zhao
Fan Yang
Zhe Fang
Contact
Sixers Consulting 6ers@upenn.edu|www.6ers.com
![]()
Prepared for the City of Philadelphia — Office of Property Assessment (OPA)