Philadelphia Housing Price Prediction
Improving Property Tax Assessments
Who We Are

Why Improve the Model?
Research Question
Identify which structural, spatial, and socio-economic predictors contribute to a more accurate Automated Valuation Model for the City of Philadelphia.
Motivation
Improving the accuracy of residential property tax assessment can mitigate inequity assessment methods, increase transparency in governmental processes, and make analysis more reliable and efficient


Data Sources
- Property Sales: (Philadelphia, 2023-2024) City of Philadelphia - OpenDataPhilly
- Socio-Economics: United States Census - American Community Survey
- Spatial Features: City of Philadelphia - OpenDataPhilly

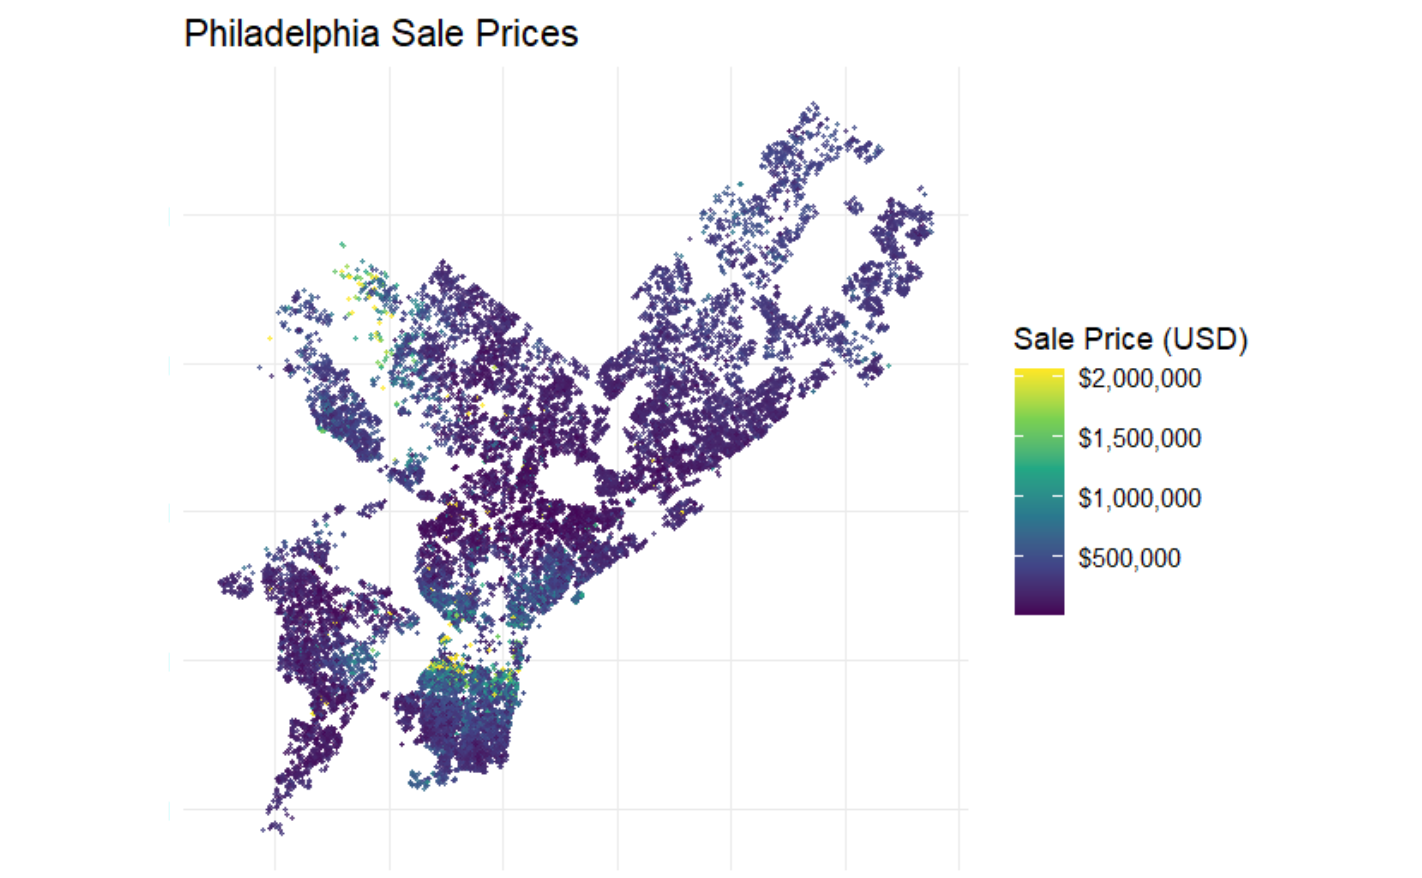
Sale Prices in Philadelphia
Higher sale prices are concentrated in Central and Northwest Philadelphia
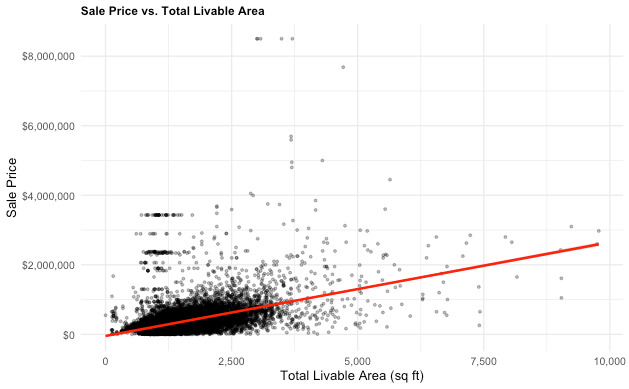
Factors Impacting Sale Price
There is a notable relationship between sale price and total livable area
Top Predictors
- In a wealthy neighborhood (\(\beta\) = 50,306.450, p < 0.01)
- Number of bedrooms (\(\beta\) = 33,544.290, p < 0.01)
- Number of bathrooms (\(\beta\) = 29,510.940, p < 0.01)
Interpretation: Higher home values in wealthier neighborhoods make sense, especially historically affluent areas with reputational appeal and historic housing stock. Higher numbers of bedrooms and bathrooms tend to indicate more total livable area, which aligns with our observation that total livable area impacts sale price.

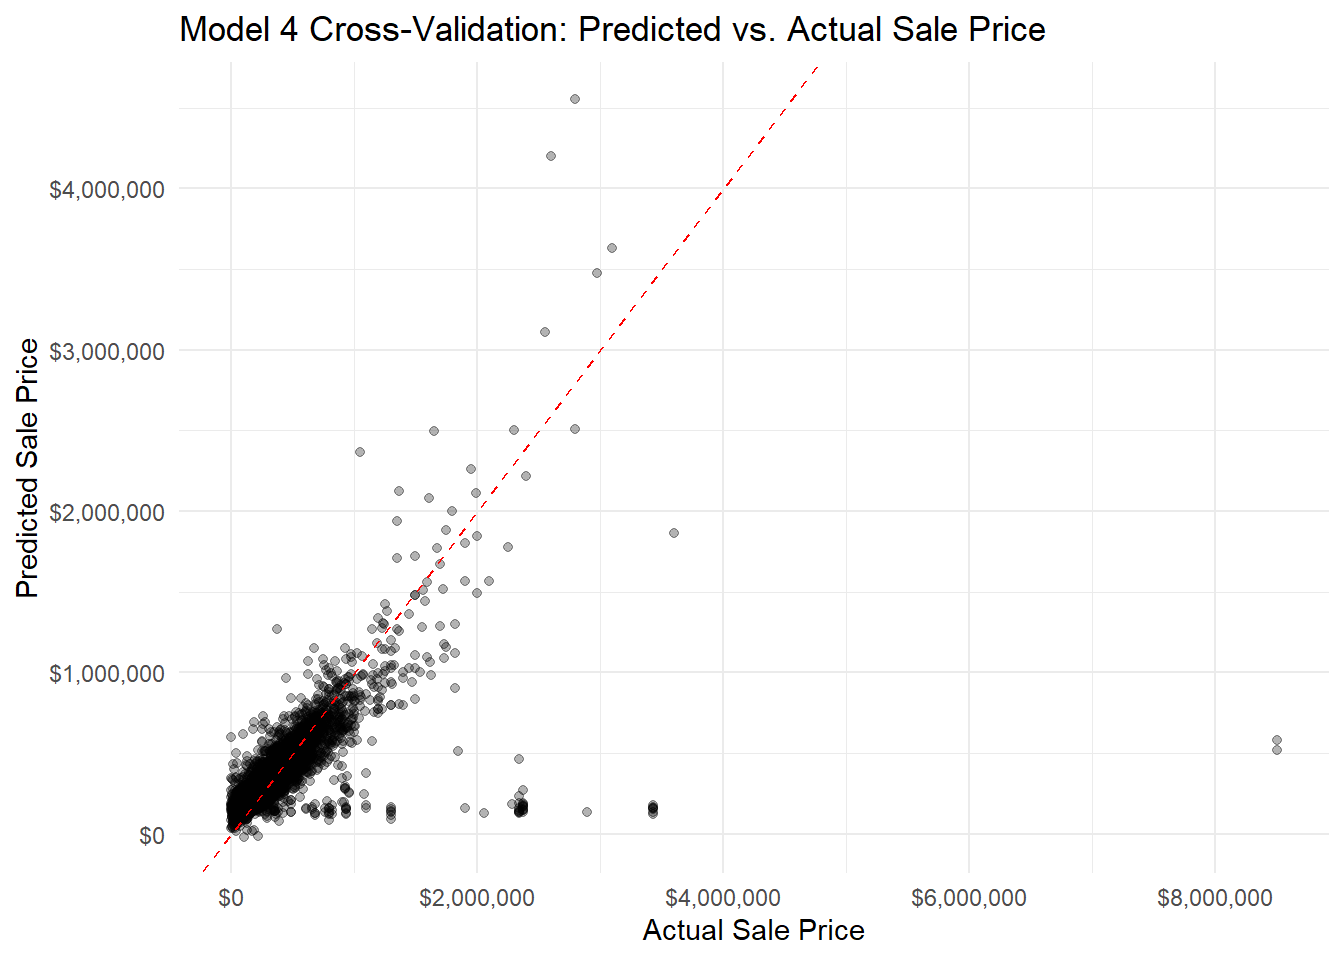
Model Performance
Model Performance by Neighborhood (Part 1)
- Neighborhoods in North Philadelphia and West Philadelphia (with the exception of University City), in addition to Chinatown are underpredicted.
- Center City and parts of Northeast and Northwest Philadelphia are overpredicted.
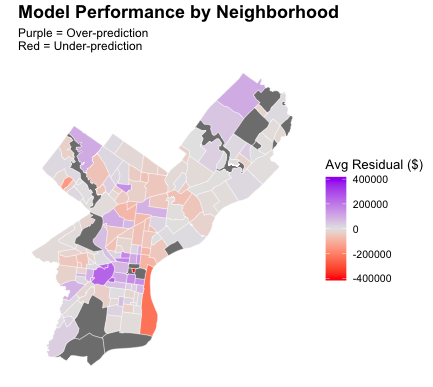
Model Performance by Neighborhood (Part 2)
- This suggests local factors not included in the model are having an impact on sale prices.
- A particular area of concern is the underpredicting of sale prices in lower-income neighborhoods in North Philadelphia.
Questions?
Thank you! from Sujan, Henry, Ryan, Kavana, Chloe, and Nina :)
Contact us at: inquiries@tnc.com