Week 2 Notes - Algorithmic Decision Making & Census Data
Algorithmic Decision Making & Census Data
Part 1: Algorithmic Decision Making
What is an Algorithm?
Def: A set of rules or instructions for solving a problem/completing a task
Algorithm Decision Making in Gov
- Systems used to assist or replace human decision-makers
- Based on predictions from models that process historical data containing:
- Inputs: features, predictors, ind. variables, x, etc.
- Outputs: labels, outcomes, dep. variables, y, etc.
- Based on predictions from models that process historical data containing:
- Read World Ex: Mortgage lending and tenant screening algorithms
Clarifying Key Terms
- Data Science: Computer science/engineering focus on algorithms and methods
- Data Analytics: Application of data science methods to other disciplines
- Machine Learning: Algorithms for classification & prediction that learn from data
- AI: Algorithms that adjust and improve across iterations
Public Sector Context
Long history of government data collection:
- Civic registration systems
- Census data
- Administrative records
- Operations research (post-WW2)
What’s new?
- More data (official and “accidental”)
- Focus on prediction rather than explanation
- Harder to interpret and explain
Why Gov Uses Algorithms
- Governments have limited budgets and need to serve everyone
- Algorithmic decision making is especially appealing bc it wrongly promises:
- Efficiency: produces cases faster
- Consistency: same rules applied to everyone
- Objectivity: removes human bias
- Cost savings: fewer staff needed (labor is expensive!!)
When Algorithms Go Wrong
Data Analytics is subjective!
- Every step involves human choice
- Data cleaning decisions
- Data coding/classifications
- Data collection (use of imperfect proxies)
- Result interpretations
- Variables chosen to be put in the model
- Human values and biases are embedded!
Bias is everywhere!
- Healthcare algorithms have systematically discriminated against Black patients
- Algorithms used healthcare costs as a proxy for need - Black patients typically incur lower costs due to systemic inequities in access - Resulted in the under-prioritization of Black patients despite equivalent levels of illness
- Criminal Justice algorithms use biased (racist) policing data
Part 2: Active Learning
Done in class
Part 3: Census Data Foundations
Why Census Data Matters
Census Data is the foundations for
- Understanding community demos
- Allocating government resources
- Tracking neighborhood change
- Designing “fair” algorithms
Connection: The same demo data used in the census goes into many of the algorithms we analyzed
Census vs American Community Survey (ACS)
- Decennial Census
- Everyone counted
- 9 basic questions (age, race, sex, housing)
- Constitutional requirement
- Determines apportionment
- ACS
- 3% of households analyzed annually
- Detailed questions (income, education, employment, housing costs)
- Replaced the old “long form census” in 2005
ACS Estimates - 1 year estimates (areas > 65,000 ppl) - Most current data, too small of sample for most use - 5 year estimate (all areas) - Most reliable data, large sample - What we use most often - Key Point: All ACS data comes with margins of error
Most policy analysis occurs at county, census tract, and block groups levels
2020 Census Innovation: Differential Privacy
- The Challenge: Modern computing can re-identify individuals from census data
- The Solutions: Add mathematical “noise” to protect privacy whilst preserving patterns
- The Controversy: Some places now show pops living underwater or in other impossible places
- Why this matters: Even “objective” data involves subjective choices abt privacy v accuracy
- Also errors
Accessing Census Data in R
We will use the tidycensus package
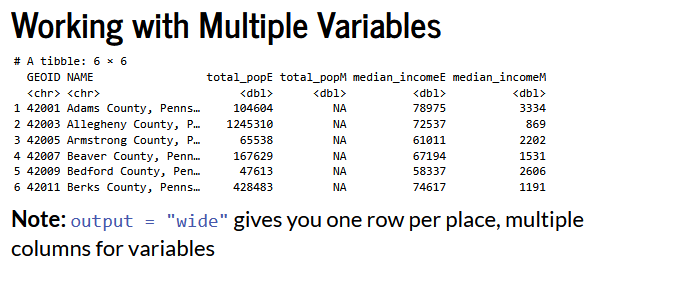
Census data structure is as follows: - Data organized into tables - i.e. B19013: Median Household Income - Each table has multiple variables - B19013_001E: Median household income (estimate) - B19013_001M: Median household incomee (margin of errro)
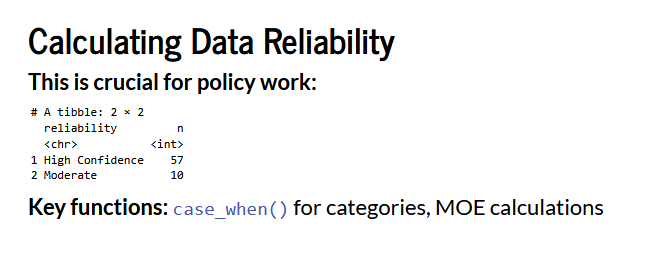
Working with margins of error
- Every ACS estimate comes with uncertainty
- Large MOE relative to estimate = less reliable
- Small MOE relative to estimate = more reliable
- In analysis:
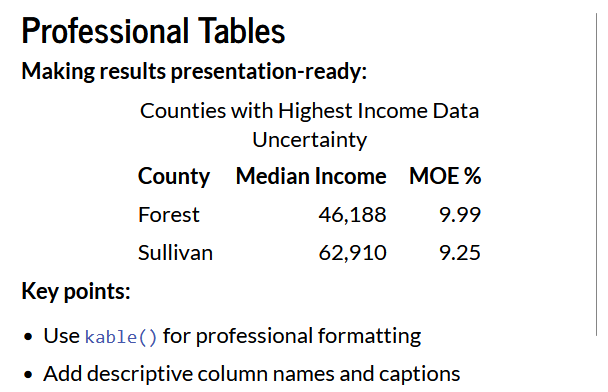
- Always report MOE alongside estimates
- Be cautious comparing estimates with overlapping error margins
- Consider using 5year estimates for greater reliability
Two types of Census Data
- Summary Tables (what we’ll mostly use)
- Precalc statistics by geo
- Good for mapping, geo comparison
- PUMS - individual records
- anonymous individual/HH responses
- Good for custom analysis, regression models
Data sources
- TIGER/Line Files
- geographic boundaries (.shp)
- Historical Data Sources
- NHGIS: Historical census data -Neighborhood Change Database -Longitudinal Tract Database: track changes over time
Part 4: Hands on Use
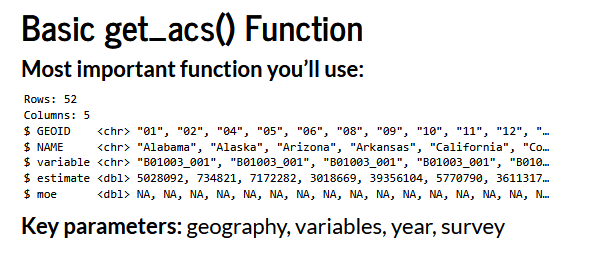
Output
GEOID: Geo identifierNAME: Human-readable location namevariable: Census variable codeestimate: Actual valuemoe: Margin of error